Canaux
108470 éléments (108470 non lus) dans 10 canaux
 Actualités
(48730 non lus)
 Hoax
(65 non lus)
 Logiciels
(39066 non lus)
 Sécurité
(1668 non lus)
 Referencement
(18941 non lus)
éléments par Sameer Singh
BetaNews.Com
-

Underhyping Snapchat
Publié: février 7, 2017, 7:58pm CET par Sameer Singh
The media, analyst and investor communities clearly have a love-hate relationship with Snapchat. In the run-up to its IPO, it was hailed as the next great technology company (in part due to Snap's own communication efforts). And now that its S-1 is out, the commentary has turned quite negative. As always, the truth is somewhere in the middle and public filings paint a very clear picture of why that is. The chart at the top of this post shows quarterly revenue for Snap compared with that of Twitter and Facebook, aligned by founding year (sourced from their respective IPO prospectuses).… [Continue Reading] -

Pokémon Go and business model innovation
Publié: juillet 12, 2016, 6:07pm CEST par Sameer Singh
After months of hype, Pokémon Go finally began rolling out in a few countries this week. At this point, I can safely say, it has turned out to be one of the biggest viral hits in recent years. While the Pokémon IP played a significant role in the game's quick uptake, I believe that Pokémon Go's status as the first accessible augmented reality game at scale will be much more important to its long-term success. There are multiple elements of business model innovation at play here, far deeper than a simple extension of pre-existing IP. Many analysts have already put… [Continue Reading] -

Google vs Apple: Contrasting approaches to app store evolution
Publié: juin 21, 2016, 5:49pm CEST par Sameer Singh
This year, Google I/O and WWDC seemed to lack the excitement seen in years past with most announcements being fairly mundane -- a combination of maintenance/incremental updates and "me-too" products -- inevitable at this point in the maturity cycle. The most interesting part of these developer events was really the contrasting approaches Google and Apple have taken to evolve the app ecosystem. Unsurprisingly, both approaches are diametrically opposed to each other and favor each company's business model. However, the "winning standard" will necessarily be one that better serves the needs of both consumers and developers. The biggest news from Google… [Continue Reading] -

Chatbots, apps and the path to victory
Publié: avril 15, 2016, 12:38pm CEST par Sameer Singh
This week, Facebook opened up its long awaited bot platform within Messenger following similar moves from LINE, Telegram and Kik. It almost seems as though bots have peaked on the "Hype cycle" in just a few short weeks since they entered mainstream discussion. This isn't a criticism of the concept, but rather of industry discourse. Chatbots certainly have potential, but where that lies is just as important as the eventual scale. Facebook demonstrated quite a few bots during this week's F8 conference. Unfortunately, it appeared as though many of them were just apps built inside a messaging app (a concept… [Continue Reading] -

Explaining the struggles of Apple Pay and mobile payments
Publié: mars 14, 2016, 4:34pm CET par Sameer Singh
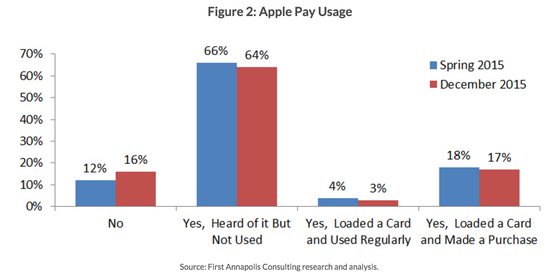
Apple Pay was introduced 18 months ago to rave reviews from the press and technology analysts. It was billed as an example of "mobile payments done right" -- simple, intuitive and painless. And yet, its impact has been muted at best, even in key western markets. According to a recent survey, 80 percent of iPhone 6 users had never used the service and just 3 percent used it regularly. Customer satisfaction among Apple Pay users remains high, but word-of-mouth appears to have had no impact on adoption. What is the cause of this divergence?
Looking at these figures, it appears that Apple Pay is struggling to "cross the chasm" between early adopters and mainstream consumers. Early adopters genuinely looking for a mobile payment solution would have no doubt been delighted by Apple Pay's implementation. However, most "normals" aren't specifically looking for a mobile payment solution. Any substitute to existing payment solutions has to be superior enough to existing offerings to break long established habits (in this case, pulling out a credit card). And it is here that Apple Pay, and mobile payment solutions in general, face a key challenge.
From the perspective of mainstream consumers, mobile payments are no more "mobile" than a credit card or cash. Security and privacy have never been a draw except for a vocal minority. The only benefit left is transaction processing time or "convenience". Last year, most early adopters (and some analysts) argued that mobile payments were so much more convenient than existing payment solutions that it was only a matter of time until adoption exploded. Except, it hasn't. And the longer you think about it, the more superficial this "convenience" argument seems.
If a "normal" iPhone user has to make a trip to the closest big box retailer, say Walmart, would Apple Pay improve his experience? Does saving ten seconds at the checkout counter matter when he has to wait ten minutes for his groceries to be scanned and bagged anyway? Even if the wait is a few minutes for other types of in-store purchases, the added convenience is minimal. At the very least, it isn't enough of an experience boost to change the deeply-ingrained habit of pulling out a credit card. Now, if the credit card itself could save a few seconds, it would be actively utilized. And that's a selling point for contactless payments, not for mobile payments.
Now, this isn't to say that mobile payments are a completely failed experiment. The convenience argument does apply when the purchased product or service is delivered instantaneously. In other words, mobile payments are a much more elegant solution when used for digital purchases made on the smartphone itself (or order ahead solutions for in-store pickup). Here, mobile payments solutions add convenience by saving you the trouble of manually adding in your credit card or verification details. Unsurprisingly, this is exactly what the survey in question found among Apple Pay users.
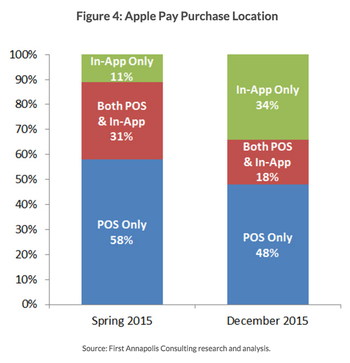
While Apple Pay usage remains low, the share of in-app transactions tripled during the survey period even among the early adopter base of Apple Pay users. Efforts to push in-store mobile payments haven't paid off until now and I don't see any trigger that will change this in the near future. It may be time for platform owners to pivot and focus marketing efforts on in-app transactions instead.
This story was reposted with permission from tech-thoughts.
 Sameer Singh is an M&A professional and business strategy consultant focusing on the mobile technology sector. He is founder and editor of tech-thoughts.net.
 -

Self-driving cars: incrementalism vs. full autonomy
Publié: janvier 20, 2016, 1:46am CET par Sameer Singh
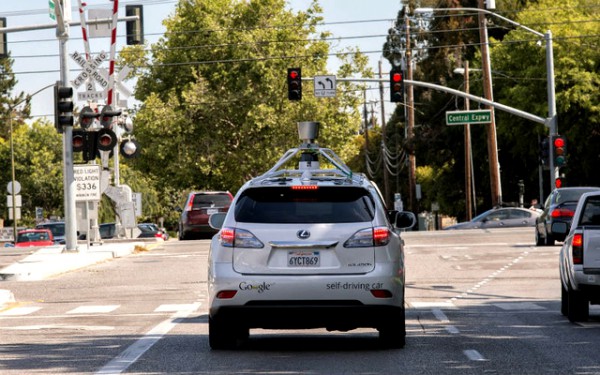
Last week, I came across an interesting piece by Jan Dawson about self-driving cars. In it, he argued that Tesla's (and possibly Apple's) approach of incremental improvements in automation was vastly superior to Google's goal of achieving full automation. His primary argument is that consumers need to purchase and experience semi-autonomous vehicles before they can trust the technology enough to purchase fully autonomous vehicles (especially given the likely cost of purchase). While this does appear to make some sense, there is a key flaw in this argument. The goals and business models of companies following these two approaches are dramatically different.
What do Tesla (and potentially Apple) want out of autonomous car technology? At least, in the short term, their goal is to sell more cars to consumers. What approach fits best with that goal? Incrementalism -- in other words, making sustaining improvements to their existing product to grow sales volumes and average selling prices. And as Jan rightly pointed out, consumers are unlikely to trust the technology behind fully autonomous cars right off the bat. Therefore, striving for incremental improvements in autonomy makes perfect sense for business models dependent on hardware sales.
What about companies like Google and Uber? Each has made a significant investment into autonomous vehicle technology, but neither has any interest in any part of the automobile distribution value chain. Google has famously eschewed the paid software licensing model, so any assertion that Google plans to charge car companies for using its software must be viewed with skepticism. Meanwhile, Uber's business model is entirely aimed at reducing car ownership. An incremental approach (starting with semi-autonomous vehicles) would make absolutely no sense for either company. Why would Uber care about the driving experience of cars on its ridesharing service? What does Google gain from the sales of self-driving cars? Even if Google robot cars rely on Google services, consumers would not.
According to press reports, Google plans to monetize its self-driving car technology through a ride-sharing service which is more consistent with its services-oriented business model. Meanwhile, Uber's goal would be to head-off any potential disruption to its business model, one that relies on the network effect between drivers and riders (fully autonomous self-driving cars -> no drivers -> no network effect -> no competitive advantage). Full autonomy is the only feasible approach here because semi-autonomous vehicles have no impact on the network effects that exist on today's ridesharing services. Google would have no hope of attracting drivers (the fundraising activity of ridesharing companies should give us some hint about the investments required to attract drivers). From Uber's point of view, semi-autonomous vehicles would not pose any sort of defense against the disruptive threat from a ridesharing service with driverless cars. Chasing full automation is absolutely the right approach for service companies because their eventual goal is to disrupt the existing model of car ownership, not to sustain it.
What about trust? Don't consumers still need to trust self-driving car technology to use these services? Yes, but it isn't nearly as important because of the costs involved. The level of trust required to make a $100,000 car purchase is dramatically higher than for a $20 self-driving car ride. There will be no shortage of early adopters willing to try these "low cost" services at least once. Once that barrier is crossed, their popularity will be entirely dependent on rider experience and word-of-mouth. Of course, a positive rider experience is far from a guarantee but that entirely depends on the quality and reliability of the technology and data (in other words, combined driving experience of the algorithm's "hive mind"). Rider experience and word-of-mouth will have little to do with pre-existing notions of consumer trust.
To summarize, my counter argument truly demonstrates the importance of studying a company's business model before assessing the efficacy of its strategy. Analyzing a services company through the lens of a hardware-based business model can only lead to flawed conclusions.
This story was reposted with permission from tech-thoughts.
 Sameer Singh is an M&A professional and business strategy consultant focusing on the mobile technology sector. He is founder and editor of tech-thoughts.net.
 -

The State Of Wearables
Publié: janvier 8, 2016, 2:04pm CET par Sameer Singh
I have been skeptical about the mass market potential of wrist-worn wearables ever since Google unveiled Android Wear in 2014. Since then, we have seen a number of high profile smartwatch launches, including the Apple Watch and the recent Fitbit Blaze (which was greeted with an 18 percent decline in FitBit's stock price).
However, the hunt for a killer app continues and I have yet to come across a relevant use case for mass market users.
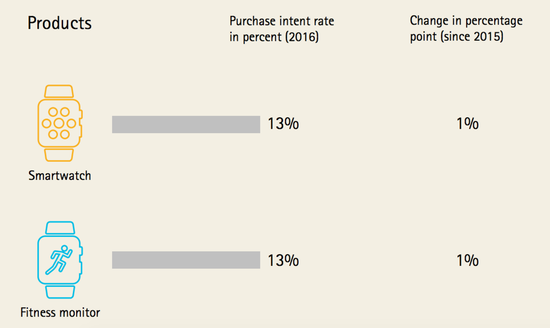
Benchmarking the current state of this product category has been challenging because of the complete lack of reliable, public data. Luckily, Accenture recently released some data that could ease our way. Accenture's survey covers 28,000 consumers across 28 countries and covers consumer interest in devices ranging from smartphones, tablets and laptops to wearables and drones. A few key insights from their survey are highlighted below:
- Only 48 percent of consumers plan to buy a smartphone in the next 12 months, down 6 points from last year. The drop was particularly stark in China, where it went from 82 percent last year to only 61 percent this year. Of those who don't plan to buy a new one, 47 percent said the main reason was because their current phone was good enough.
- Similarly, the survey showed an eight-point drop in purchase intent for tablets, and a six-point drop for laptops. Overall, only 13 percent expected to spend more on smartphones, tablets, and laptops this year than last year. That's compared with 33 percent who said they were planning to spend more in 2014 than 2013.
- Most worryingly, interest in wearables and connected devices was flat from last year, and purchase intent is relatively low.
Unsurprisingly, "good enough" smartphones have had a noticeable impact on upgrade intent. This was something I pointed out two years ago, but in hindsight I called it too early back when industry-wide smartphone screen sizes were still not "good enough". The more interesting takeaway to me is that purchase intent for smartwatches and fitness trackers has not increased despite the high profile product launches, massive ad campaigns and expanded distribution we saw in 2015. With wearable shipments growing sequentially (from an admittedly small base), shouldn't we expect word-of-mouth to have some sort of impact on purchase intent?
Thanks to Endeavour Partners research from mid-2015 (already dated by now), we know that smartwatch abandonment rates continue to be high and this is a key metric to watch. The lack of an obvious value proposition for mass market consumers is a clear drawback and appears to be dampening word-of-mouth. Of course, this data is more backward looking than it appears (as most consumer surveys are). Purchase intent is a function of the value communicated by a product, based on existing capabilities. New capabilities unforeseen by consumers can have a dramatic impact on these responses. But new capabilities are largely a function of app innovation, which has been hampered without access to new contexts or input models.
This is why I have largely based my skepticism not on current smartwatch iterations, but on what they can become in the future.
This story was reposted with permission from tech-thoughts.
 Sameer Singh is an M&A professional and business strategy consultant focusing on the mobile technology sector. He is founder and editor of tech-thoughts.net.
 -

YouTube Red: Trigger for cord cutting?
Publié: octobre 30, 2015, 2:01pm CET par Sameer Singh
YouTube announced its first-ever subscription service last week, YouTube Red, with the usual set of (uninteresting) "premium" features -- ad-free videos and offline/background playback. The only interesting tidbit was that YouTube Red would also house "original" movies and TV shows starring well-known YouTube personalities. While it may seem mundane, this move has the potential to present a true disruption to the TV industry.
For years, industry observers have talked about the looming threat of cord-cutting -- consumers were expected to drop expensive cable subscriptions in favor of on-demand streaming services like Netflix. But while Netflix has seen exceptional growth, we are yet to see a tipping point in cord-cutting behavior.
This is because content creators (production studios, sports leagues, etc.) really hold all the leverage in negotiations with distributors (like Netflix). In response, Netflix began producing its own original content. The problem: Netflix was competing against incumbent production houses for the same talent (actors, writers, producers).
As a result, Netflix's originals inherited more or less the same cost structure as Hollywood production studios along with their inherent risks, but with less favorable subscriber economics. This limited the scale of content creation.
Now compare this with YouTube's approach to developing originals. By tapping into their base of homegrown stars and offering a cut of subscription revenue, YouTube's cost structure for content creation could be dramatically lower.
As the share of revenue earned by content creators is a function of subscriber time spent, it could incentivize other YouTube channels to create their own long-form content (30-60 minutes) exclusively for YouTube Red. The resulting scale of "original" content on YouTube Red could eventually rival cable.
In addition to scale, creating a parallel library of premium content also gives YouTube another strategic advantage. Teenagers who have grown up watching YouTube could increasingly gravitate towards long-form content produced by personalities and brands they are familiar with. Long-term, this could decrease interest in traditional movies and TV shows (maybe even sports), leading to real cord-cutting.
This story was reposted with permission from tech-thoughts.
 Sameer Singh is an M&A professional and business strategy consultant focusing on the mobile technology sector. He is founder and editor of tech-thoughts.net.
 -

Google's Amazon Problem
Publié: octobre 21, 2015, 9:21pm CEST par Sameer Singh
I have long been a critic of the "Peak Google" argument because it is based on a flawed premise -- that deep engagement and consequently "brand advertising" are somehow a threat to Google's model of transactional engagement. While I strongly disagree with that line of reasoning, there are other threats that Google faces within the transactional realm.
Search advertising drives the vast majority of Google's revenue and the most profitable searches are frequently those that are made with the intent to purchase. These purchase-oriented searches are hardly monolithic but can broadly be categorized into B2B and C2B searches. C2B searches can be broken down further into products and services. Looking at taxonomy of transactional opportunities makes it clear that the threat from "deep engagement" is vastly overstated. Facebook is a great place to generate awareness but it's hardly a way to reach customers looking for something specific. Also, breaking down the gamut of transactional opportunities makes it easier to identify threats.
Google doesn't really face a host of challenges in a transactional B2B context (especially valid for high-volume SMB searches, e.g. buying office furniture). On the C2B services side, on-demand startups are a threat but not a major one given the breadth of possible needs (e.g. travel, legal representation, car repair, insurance, etc.). This leaves C2B product searches (e.g. buying a phone). If these searches eventually lead consumers to the same vendor, wouldn't it be more convenient for consumers to "cut out the middleman"? This may already be happening. According to a recent survey, 44 percent of US shoppers go directly to Amazon for product searches, while 34 percent go to search engines (notably, Google). On mobile, where speed is of the essence, it is safe to assume that the percentage of mobile searches would be even more skewed in favor of Amazon.
How could Google possibly counter this threat? Simple; by moving a step back. Google's current transactional model targets users that are already aware of their intent to purchase -- the same users that Amazon targets. But if Google could predict intent, it could reach users one step before they put that intent into action.

This appears to be Google's primary focus with Now on Tap, the tentpole feature accompanying Android 6.0 Marshmallow. In many cases, consumers discover needs through conversations with others and many these conversations happen on smartphones. By inserting themselves into the layer between conversation and action, Google is set to gain a key competitive advantage over other forms of transactional engagement. The fact that this covers both C2B products and services also allows Google to create a defensive moat around their model. This shows how important Android is to Google's future, even though it is not and was never meant to be a standalone business.
This story was reposted with permission from tech-thoughts.
 Sameer Singh is an M&A professional and business strategy consultant focusing on the mobile technology sector. He is founder and editor of tech-thoughts.net.
Photo credit: photogearch / Shutterstock
-

My Apple Watch estimates: 3 million shipments, 2.5 million sales
Publié: juillet 22, 2015, 10:19pm CEST par Sameer Singh
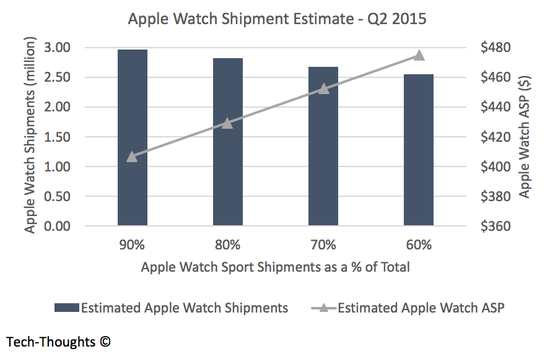
After months of speculation, Apple finally released some vague numbers related to the Apple Watch. As a part of their fiscal Q3 2015 earnings release, Apple announced that revenue from "Other Products" including the Apple Watch, iPod, Apple TV and other accessories totaled $2.64 billion during the quarter. This compares to roughly $1.69 billion in fiscal Q2 2015, before Apple Watch sales began. Combined with some comments from Tim Cook, this should help us get to a rough estimate of Apple Watch shipments (if not sales) for the quarter. We can then also compare this estimate with the third party data sources I highlighted in my last post.
Apple's CFO Luca Maestri mentioned during the earnings call that the Apple Watch was responsible for more than 100% of the sequential revenue growth of "Other Products" because of a decline in revenues from non-Apple Watch products like the iPod, Apple TV and other accessories. If we assume a 15% sequential decline in revenue from those products, we can attribute roughly $1.2 billion in revenue to the Apple Watch.
Things get trickier from here as the average selling price (ASP) of an Apple Watch heavily depend on the product mix between various models. I've assumed that the $10,000+ Apple Watch Edition comprised just 0.1% of sales. Beyond this, the share of the Apple Watch Sport (the cheapest model starting at $349) heavily influences the ASP. If the Apple Watch Sport comprised 60% of overall Apple Watch shipments, the ASP would come it at roughly $475 implying roughly 2.5 million Apple Watch shipments. But if the Sport model took 90% of shipments, the ASP would be below $410 which gives us a shipment figure just under 3 million units. All things considered, 2.5 to 3 million units seems like a reasonable estimate for shipments.
But beyond missing analyst estimates (despite reports of poor sales, some analysts had expected shipments as high as 5 million), this number doesn't mean a whole lot by itself. But it does give us a frame of reference to compare next quarter's numbers and those from third parties. How does this compare to the widely criticized estimates from Slice Intelligence?
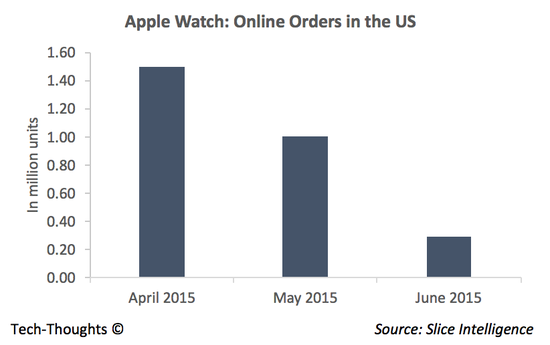
Slice had estimated 2.79 million online-only sales (not shipments) through mid-June in the US. Based on Apple's numbers, it appears as though Slice actually overestimated sales by a significant margin. The only other possibility is that sales outside of the US and through retail channels were non-existent. I would normally not discount that possibility, but I have to believe that there was at least an initial burst of sales in China.
But, again, the most important part of Slice's report was the trajectory of sales. Given Apple's reported figures, the initial surge of online orders and subsequent supply shortfall, it is very likely that sales tailed off after launch (with additional retail sales, the overall decline would have been lower than Slice estimated). However, Tim Cook claimed that sales in June were higher than those in April or May. At face value, this doesn't appear to match Apple's reported figures. However, this could be the result of supply ramp up after initial orders outstripped available inventory (credit to @sbono14 for the tip).
Tim Cook also claimed that sell-through of the Apple Watch after 9 weeks was greater than the original iPhone and iPad. For context, iPad shipments totaled 3.27 million in fiscal Q3 2010, roughly 11 weeks after launch. We can reasonably assume that iPad shipments over a 9-week period would have totaled about 2.7-3 million, of which 2.3-2.5 million may have been sold to consumers. Given the constraint of 3 million Apple Watch shipments, 2.5 million should be a reasonable estimate for Apple Watch sell-through. Admittedly, this is more of a "guesstimate", but that's all we have to work with at this point.
If we assume that Slice's pre-order estimates were right (they were consistent with estimates from other analysts), the Apple Watch sold roughly 1.5 million units at launch and roughly 1 million units since then. Of course, this 1.5 million figure refers to online orders and early supply constraints would have ensured that shipments (and revenue recognition or reported "sales") remained below this figure. Even if that pre-order estimate is off, I seriously doubt it would have been below 1 million units (the supply bottlenecks wouldn't make sense if this was lower), which would give us an estimate of roughly 1.5 million sales for the remainder of the quarter.
To summarize, it appears that Apple shipped 2.5-3 million Apple Watches into the channel and roughly 2.5 million may have been sold to consumers. Of these, roughly 1-1.5 million were sold at launch to loyal Apple users and another 1-1.5 million units may have been sold for the remainder of the quarter. This slowdown suggests that word-of-mouth for the Apple Watch has been less than stellar. It is possible that native apps could change this. But given the constraint-benefit trade-off on smartwatch platforms, app development may not be as much of a home run as it seems.
This story was reposted with permission from tech-thoughts.
 Sameer Singh is an M&A professional and business strategy consultant focusing on the mobile technology sector. He is founder and editor of tech-thoughts.net.
 -

Google Now on tap: PageRank for apps
Publié: juin 19, 2015, 8:31pm CEST par Sameer Singh
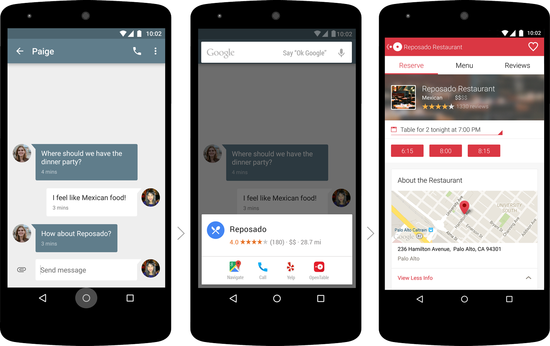
Google's implementation of the PageRank algorithm was a transformational moment for the desktop web. In the pre-PageRank era, scouring search directories for relevant websites and manually typing long URLs into a browser's address bar was common. Google's use of links as a "voting" system for discovering websites changed online discovery forever. The app interaction and discovery model prevalent today bears many similarities with the pre-PageRank era of the web, with apps listed under numerous app store categories. Google's Now on Tap may usher in the very "PageRank for Apps" era we have been waiting for.
Before diving into the importance of Now on Tap, let's take a look at how Google describes the service:
We’re working to make Google Now a little smarter in the upcoming Android M release, so you can ask it to assist you with whatever you’re doing -- right in the moment, anywhere on your phone. With "Now on tap," you can simply tap and hold the home button for assistance without having to leave what you’re doing -- whether you’re in an app or on a website. For example, if a friend emails you about seeing the new movie Tomorrowland, you can invoke Google Now without leaving your app, to quickly see the ratings, watch a trailer, or even buy tickets -- then get right back to what you were doing.
If you’re chatting with a friend about where to get dinner, Google can bring you quick info about the place your friend recommends. You’ll also see other apps on your phone, like OpenTable or Yelp, so you can easily make a reservation, read reviews or check out the menu.
When you tap and hold the home button, Google gives you options that are a best guess of what might be helpful to you in the moment.
Today, users discover apps by browsing through app stores or through advertising / social channels and word of mouth. But now, Google is building ability to suggest apps to users based on what they require most at that very moment. In other words, instead of indexing websites and using links as the voting system, Google appears to be indexing apps and using live, in-app information as the voting system. This changes the workflow for users as jumping from app to app becomes much easier and completely cuts the smartphone homescreen out of the equation.
Suffice to say, this has the potential to completely reshape the app interaction model as we know it today. If the service works as expected, launching an app from a homescreen may soon be as alien a concept as manually typing a URL into a browser's address bar.
Of course, this also dovetails perfectly with Google's monetization model. Except for one, Now on Tap gives Google all the required assets to implement an Adwords-equivalent advertising model for the mobile era -- knowledge of user context (instead of keywords) and screen real-estate across all smartphone apps (instead the search page). The only missing ingredient is a contextual bidding system for ads on Now on Tap cards. This seems to be a few years away as well, but the direction of Google's evolution has now become clear.
This also seems to have thrown a spanner into the Peak Google narrative we've heard so much about. This was inevitable as asymmetric business models (like Google's) have been continually misunderstood by pundits. Just as we saw in the case of post-IPO Facebook, critics ignored Google's investments into intermediate products and the assets gained from them. Now on Tap is the clearest possible indication of the latent value held by these assets.
This story was reposted with permission from tech-thoughts.
 Sameer Singh is an M&A professional and business strategy consultant focusing on the mobile technology sector. He is founder and editor of tech-thoughts.net.
 -

Comparing Facebook's and Google's vision for mobile
Publié: mars 27, 2015, 1:15pm CET par Sameer Singh
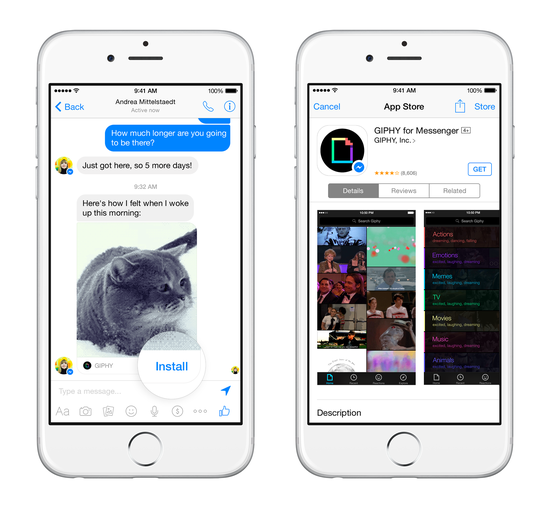
On the first day of the F8 developer conference, Facebook finally pulled the trigger on something we had expected for months. Facebook messenger is now a platform along the lines of WeChat and other Asian messaging apps. While this isn't necessarily "novel", it tells us something about Facebook's vision for mobile.
Facebook announced the SDK for messenger along with the fact that 40 apps, including ESPN, Dubsmash, and Talking Tom and Giphy had already signed up for the program. Their willingness is simple to explain -- app stores have fixed the app distribution problem, but have consequently made app discovery far more difficult. Easy app distribution and low entry barriers have created a deluge of app developers with more than a million apps and counting. But with these numbers, app developers have found it increasingly difficult to reach consumers through all the noise. This is where Facebook Messenger comes in:
Messenger Platform apps can display the option for a person to install the app from within Messenger, or to reply using content from the app. If the person receiving the message doesn't already have an app installed, they can tap Install to be taken directly to the app store to get started using the app. This means people can discover apps recommended by their friends, naturally through their conversations.
With Messenger Platform, developers may also see increased app engagement: If the person receiving the message already has the app installed, they'll be able to tap Reply on an image in a message. Then, instead of scrolling through pages of apps on their phone, they'll be taken directly to the app to reengage and respond with relevant content.
In essence, Facebook seems to be implementing natural "links" between apps, i.e. user interactions flow from app to app, much like the desktop web. Facebook's vision seems to rely on their network of users and their social interactions to solve the app discovery problem. This presents an interesting contrast with Google's vision -- an algorithmic to present the right information in the right context. It's no surprise that each company's vision is entirely built on their inherent strengths. But I'm actually starting to think that their contrasting approaches are much more complementary than they might appear.
On a simplistic level, both Google and Facebook are direct competitors because they build mobile services and generate revenue from advertising (made more valuable because of data-driven targeting). While this is true when it comes to monetization, each company follows a very different approach to craft a value proposition for their users. Google follows an algorithmic and data-driven approach to organize and provide users with information (e.g. Google Maps, Search, Google Now). In contrast, Facebook's approach is less data driven and more reliant on enabling social interactions between users. Once you look at the two companies through this lens, it actually seems as though both visions are somewhat complementary. Gathering information is just as important as spreading it.
Extending this argument to app discovery, social vs. contextual discovery may fit different kinds of apps. It's no surprise that most of Facebook Messenger's initial partners are publishers or content-based apps. Social discovery seems to fit these kinds of apps like a glove. On the other hand, apps that are more transactional in nature (on-demand transportation, or anything that involves mobile commerce) are likely to favor a more algorithmic approach (a user is more likely to use Uber/Lyft when he lands at an airport, irrespective of his/her social interactions).
This story was reposted with permission from tech-thoughts.
 Sameer Singh is an M&A professional and business strategy consultant focusing on the mobile technology sector. He is founder and editor of tech-thoughts.net.
 -

Google, mobile and the next billion
Publié: mars 1, 2015, 12:45am CET par Sameer Singh
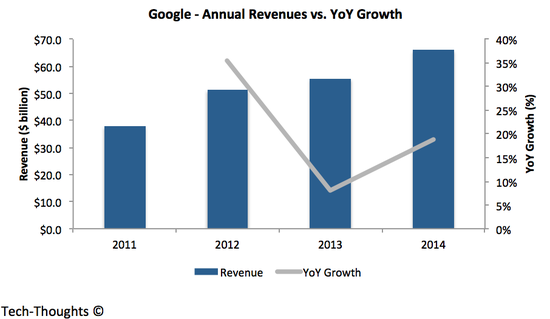
The change in Google's narrative over the past few months has been very interesting to watch. The recent "Peak Google" proclamations remind me of Facebook's post-IPO narrative in 2012. Conventional wisdom back then was that Facebook's decline was imminent as mobile was not a meaningful part of their revenue. Of course, Facebook's app install ads and other mobile initiatives disproved that narrative in short order.
Some observers even make it seem as though Google's growth has seen a major slowdown in 2014. Interestingly, both Google's revenue and operating profit growth accelerated in 2014. This isn't to say that mobile does not pose a challenge to Google. It does, but it is important to understand exactly what those challenges are and the way forward. By looking at Google's financial reports, their biggest challenge is a decline in operating margins. This has been triggered by increase in search advertising on mobile, which delivers lower CPCs. While consumers used search on PCs for more involved research on products/services, the interaction window for mobile search is shorter. Lower ad engagement led to fewer bids on keywords and consequently, lower CPCs and margins.
While there has been talk of "brand advertising" being the next big opportunity on mobile, a look at Facebook's mobile growth suggests that transactional opportunities remain massive. Facebook used app login data to create a targeting engine for app install ads, which drove a significant portion of their growth on mobile. As the app economy continues to grow and extend its economic influence beyond app store revenues, app install (or engagement) ads will remain a lucrative opportunity on mobile. This is one area where Google has been a laggard, even though they clearly have the assets (app usage data, access to developers/brands, Google Play, Google Now) to be a market leader.
Unsurprisingly, we now have evidence that Google has not been ignoring this opportunity -- the company just announced the launch of app install ads on Google Play. In my opinion, this is Google's first step towards a major opportunity, i.e. contextual app install or "access" ads implemented via Google Now.
This should provide a counter-argument to one segment of the current narrative surrounding Google. I have also heard another, more puzzling argument that goes something like this -- The next billion smartphone users will experience the internet for the first time. These users (e.g., a farmer in Africa or India) will have very different needs and far lower purchasing power, which could challenge Google's business model. It's not that I don't agree with this argument, I do. It's just that this argument is applicable to every tech giant in the world, from Google to Facebook to Tencent. These consumers may use Google search, Facebook, Whatsapp or a host of other apps. But they aren't valuable to Google or Facebook's advertisers and they aren't likely to be major in-app purchasers. How exactly are WeChat or Snapchat going to monetize these users? The answer I hear most often is "services". But which services? And how will they be monetized?
In my opinion, there are business models that could cater to this segment (e.g. monetizing usage data directly through by-products of usage), but they seem to fit smaller services companies like Duolingo or Opensignal. As a result, I expect to see a split in companies that cater to today's mass-market consumers and those that cater to "the next billion". And that isn't necessarily a risk for today's tech companies (for now) because these monetization models also require very different businesses.
This story was reposted with permission from tech-thoughts.
 Sameer Singh is an M&A professional and business strategy consultant focusing on the mobile technology sector. He is founder and editor of tech-thoughts.net.
Photo credit: ljh images / Shutterstock
-

There is no smartwatch market
Publié: février 13, 2015, 3:19pm CET par Sameer Singh
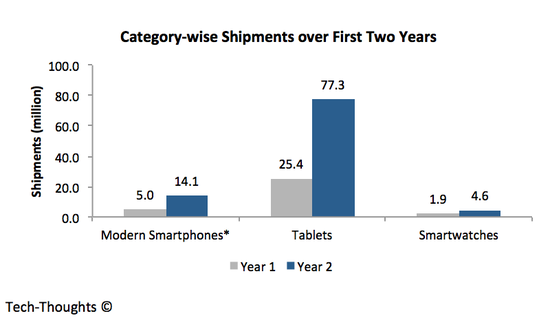
A few months ago, I wrote a post comparing the early sales of smartwatches to those of tablets and modern smartphones (early iPhone and Android models). As I expected, the numbers didn't bode well for smartwatches. Now that we have another year's worth of data to play with (from Canalys this time), we have an opportunity to test the validity of my previous analysis.
The chart above plots smartwatch shipments against smartphone and tablet shipments for two years after the point when each category was meaningfully conceived. Data on smartwatch shipments has been combined from multiple sources including Canalys, Strategy Analytics and ABI Research. Now compare this updated chart with my previous observations.
The first observation from the chart is that early tablet shipments dwarfed those of modern smartphones and smartwatches. But even modern smartphone shipments more than doubled those of smartwatches. The smartphone-tablet dichotomy is fairly easy to explain. The iPhone and other modern smartphones relied on a completely new interaction model (capacitive touch and multitouch) which most consumers had never used before. In addition, this was in the "pre-appstore" era when software distribution was still unclear. By the time tablets were unveiled, both consumers and developers were comfortable with the interaction model and appstores, i.e. tablets had no real learning curve.
In some ways, smartwatches have had the same advantages that tablets enjoyed. The interaction model doesn't seem drastically different (compared to the transition from keyboard/mouse to touch) and appstores are well established. They also benefited from Samsung's offer of a free Galaxy Gear with the Note 3 phablet. Despite these advantages, smartwatch shipments have remained well below those of early smartphones and tablets.
It is clear to me that smartwatch technology has improved significantly over the past year. But the fact that this has had no impact on consumer adoption should be worrying. It is becoming increasingly clear that the use cases targeted by smartwatches (at least today) are primarily valued by a niche segment of technology enthusiasts. The list of questions about wearables, seems to be getting longer, but we are no closer to finding answers.
Update:
- The data in my chart includes all wearable wristbands, including fitness trackers. If we drill down to just smartwatches like the Pebble and Android Wear devices, year 2 shipments drop to around 1.5 million.
- The measurement period begins when products relying on the dominant interaction models are introduced to the market, i.e. a touch interface that does not require a stylus for smartphones / tablets. App developers play a major role in discovering use cases, but those still depend on the advantages and drawbacks inherent to the interaction model. Would Angry Birds be a viral hit if users had to fiddle around with a keypad? With this context, it may even make sense to exclude Pebble shipments to make a more accurate comparison (<1 million in Year 2).
This story was reposted with permission from tech-thoughts.
 Sameer Singh is an M&A professional and business strategy consultant focusing on the mobile technology sector. He is founder and editor of tech-thoughts.net.
 -

The potential and pitfalls of HoloLens
Publié: janvier 22, 2015, 10:31pm CET par Sameer Singh

Microsoft made some long expected announcements today -- the return of the start menu, one version of Windows 10 across all devices and an attempt to make Windows apps work across those same devices. Unfortunately, the limited overlap between Windows PC developers and mobile developers makes the latter a weak proposition. On the other hand, Microsoft's HoloLens headset may have some potential.
I have long been a believer in the long-term potential of "field of vision" devices (AR and VR) for one simple reason -- despite their downsides, their potential benefits cannot be matched by existing computing platforms. In my opinion, this is a necessary (but not sufficient) condition for triggering a new market disruption. While we are still in the early stages of the technology (think first mobile phone, not first smartphone), I believe we could see increasing consumer interest in this category over the next five years.
Looking at HoloLens specifically, it holds a couple of advantages over other field of vision devices we have seen so far -- 1) It is not meant to be mobile (at least for now) so social acceptance will not be a barrier, 2) It blends elements of augmented reality and virtual reality. The second point is particularly interesting as it falls between the "glance" based interaction model targeted by Google Glass and the complete immersion provided by Oculus. By allowing users to interact with virtual, 3-dimensional objects (not really holograms) in their surroundings, Microsoft is exploring a truly novel interaction model here. Another good sign is that hands-on experiences of the device from enthusiasts and the press seem fairly positive. Increasing awareness could help attract developers that are interested in exploring new interaction models. All in all, it seems like Microsoft is going in the right direction with this technology.
That said, there are some very obvious pitfalls here for Microsoft. Since this isn't meant to be a "mobile" device, it could potentially be used in conjunction with other devices. Microsoft showed off this particular use case in the "Mars demonstration" -- Users on their PC could move their mouse cursor "off screen" to interact with the virtual environment. There may be a temptation here to link the HoloLens technology (or platform) with Windows to increase developer interest on their mobile platforms. That could immediately shrink an already small early adopter base and cause mobile developers to look at options like Oculus and Magic Leap. But as long as Microsoft plays their cards right, they may be on to something here.
This story was reposted with permission from tech-thoughts.
 Sameer Singh is an M&A professional and business strategy consultant focusing on the mobile technology sector. He is founder and editor of tech-thoughts.net.
 -

Expanding on 'New Questions in Mobile'
Publié: décembre 12, 2014, 11:14am CET par Sameer Singh

Benedict Evans recently wrote an insightful piece exploring new questions for the mobile industry. Among the five questions he brought up, I believe that the evolution of interaction models and messaging will end up being the most important.
I don't have anything to add there as think Benedict's analysis here was excellent. However, I do think that three of his questions could benefit from deeper analysis. I also think that he may have missed a crucial question brought on by the scale of the mobile industry.
What Is Android Going To Be?
This is a very popular question among some industry observers. Benedict's assertion here is that Google's control over the Android platform isn't guaranteed as the appeal of Google apps is limited and user engagement with Google Play is lower than that on iOS. As I argued in the AOSP Myth, this may be a weak argument. In a hyper-competitive industry, it is very difficult for a "Google-free" OEM to compete if 5-10 other OEMs are selling the same device, at the same price, with Google services. This is why China is a bit of a red herring -- there aren't really any devices sold in China with Google services.
The easiest way to understand this is through an economic concept called the Prisoner's Dilemma:
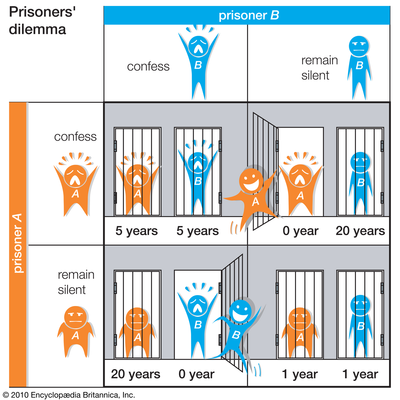
As per the classic example, two prisoners are interrogated individually and are given the opportunity to betray the other or remain silent. The "payoffs" are as follows:
- If A and B each betray the other, each of them serves 5 years in prison
- If A betrays B but B remains silent, A will be set free and B will serve 20 years in prison (and vice versa)
- If A and B both remain silent, both of them will only serve 1 year in prison (on the lesser charge)
In effect, the best payoff for both prisoners will be achieved if both remain silent. But the best individual payoff requires each to betray the other. So the only rational course for any self-interested party (like profit-generating enterprises) is to betray each other. In the case of Android OEMs, it may benefit the whole industry (from a differentiation and profit standpoint) to fork Android and exclude Google services. But the threat of selling a non-competitive forked device, while others sell devices with Google services is too great for this to ever happen. Therefore, the only option left is to continue selling compatible, Google-licensed products. With this background, it should come as no surprise that Chinese OEMs (even those with customized firmware, like Xiaomi) have continued to rely on Google services outside China.
Forking becomes even more problematic from an ecosystem viewpoint. As Visionmobile explains in "The Naked Android", Google has been pulling core APIs away from open source Android for years. Many of these APIs, including location services, billing, C2D messaging, syncing, etc., are now housed under the licensed Google Play Services umbrella. This means that any prospective "forker" will have to replicate these APIs and convince app developers to build customized variants of Android apps for their user base. Unfortunately, the install base of these prospective "forkers" never justifies the incremental cost for app developers, which automatically makes their business model unviable. This is why Xiaomi continues to emphasize that MIUI is a "compatible fork". Could we see more forks in the years ahead that are compatible with Google services? Of course, but that isn't necessarily against Google's interest.
This isn't to say that Google would never merge Android and Chrome. That could certainly happen, but it will probably be driven by the evolution of interaction models and not the threat of forking.
Facebook and Amazon
One assertion Benedict makes here is that Amazon and Facebook are motivated to insert themselves between users and platform owners, but haven't yet been able to. The first half of that statement is certainly accurate, but the second half isn't necessarily true. Benedict's analysis here is restricted to high profile failures like the Fire Phone and Facebook Home.
While Amazon hasn't had much success here, Facebook has. Integrating Facebook login with Android and iOS apps has helped it collect usage data that is monetized through targeted app install ads. In other words, Facebook has in fact facilitated and monetized app discovery by inserting itself between platform owners and users. App install ads are now a significant revenue driver for Facebook -- a revenue opportunity that Google is still trying to capture.
Wearables
Benedict's point here is that wearables are end points for cloud services and that watches are largely messaging and notification devices. I agree that wearables are meant to be end points for cloud services, but it is still very unclear how mainstream users will (or won't) use these technologies. Messaging and notifications are useful benefits when looking at the market from an early adopter's viewpoint, but it is still unclear if these use cases are necessary (or even valid) in the mass market. The diffusion of innovations can help shed some more light here:
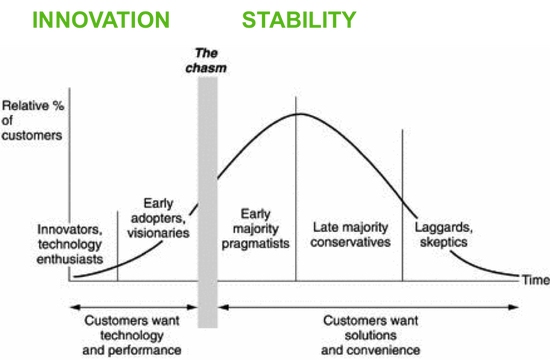
Innovators and early adopters are normally drawn to novel technologies, but these products eventually "fall into the chasm" unless they evolve to solve real problems for mainstream customers. For example, smartphones evolved from being fancy, touchscreen phones to full-fledged pocketable computing devices. At this moment, wearables and smartwatches are at the far left hand side of this curve. Early consumer interest in these devices is mostly driven by the technology, the companies behind these products and specialized use cases. What is still unclear is the primary benefits of these products for the "non-tech savvy" or their potential to become full-fledged computing platforms. This is why the list of questions for wearables is much longer than this one.
As I wrote in "Imagining The Next Big Platform", I certainly agree that devices like Oculus have much more potential to make much more fundamental changes to the basic touch-based interaction model. But this is still many years away for mainstream users (probably even more to the left on the diffusion chart).
Scale & Business Models
Benedict did touch upon scale in his post, but I think he missed a crucial question here. There are close to 2 billion smartphone users today and that will grow to roughly 4 billion over the next few years. However, the purchasing power of these users will be far lower than that of the existing user base, i.e. they will probably buy $25-$50 devices and not $600 or even $200 devices. How do you monetize a user who can only afford to pay $25-$50 for a phone?
At these price points, hardware margins will be razor thin, so companies will have to rely on a services-based monetization model. But even existing monetization models for apps and services will need to evolve to capture value from these users. These users are unlikely to have credit cards and even with carrier billing, their purchasing power may not be strong enough for in-app purchases to be meaningful. Advertising could add some revenue, but how much will advertisers pay to reach a user at these income levels? Therefore, technology companies will have to explore novel business models that purely rely on vast user numbers to profit from mobile scale. Discovering these business models over the coming years will be the most exciting part of studying this industry.
This story was reposted with permission from tech-thoughts.
Sameer Singh is an M&A professional and business strategy consultant focusing on the mobile technology sector. He is founder and editor of tech-thoughts.net.
Photo Credit: xavier gallego morell/Shutterstock
-

Tablets: Quest for the enterprise
Publié: octobre 18, 2014, 2:15am CEST par Sameer Singh
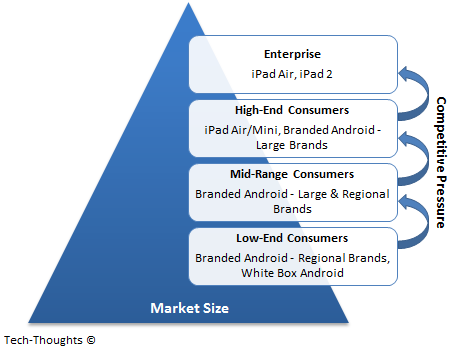
Yesterday, Apple announced a minor refresh to their iPad portfolio, with improvements mostly focused on Touch ID and a thinner footprint. In many ways, this did feel like this was a "placeholder" upgrade. The new iPads would certainly appeal to loyalists, but they don't seem to target the primary reasons behind the recent slowdown.
The slowdown in iPad sales (or high-end tablet sales, in general) was caused by three factors -- 1) Increasing overlap in use cases of large screen smartphones (or phablets) and tablets, 2) Inability to move downmarket, despite lower iPad Mini prices, because of competitive reasons highlighted in the chart above, and 3) Limited upmarket mobility because of a lack of developer focus around productivity.
With the release of the iPhone 6 Plus, the first factor really plays into Apple's hands. If you have to cannibalize your own products, doing it with a higher margin product is the most painless way to go. The second factor is a market reality and there is little Apple or any other company can do about it. This leaves an upmarket move as the last remaining option to boost tablet sales. While Apple's IBM deal could help here, that is only a small part of the solution.
In the enterprise, tablet use is still restricted to highly specialized use cases -- executives use them to take down notes, check email, etc. and sales staff in the field use them on the go. The primary issue is that developer innovation focused on tablet productivity has been minimal so far. Developers are partially to blame here because smartphones seemed like the more lucrative market. But OEMs and platform owners have to share some of the blame as well.
Of all the tablets and platforms released so far, only the Surface Pro seemed to target productivity. Unfortunately, Microsoft made major sacrifices in ease of use and pricing to get there. Combined with their ecosystem handicap, this created a compromised tablet and PC experience. On the other hand, Google seems to have taken a step in the right direction with the Nexus 9's keyboard cover. While the Nexus 9 is unlikely to see meaningful sales, it could have a very "Nexus 7-like" impact. So far, tablets with keyboard attachments have remained a novelty. But if more OEMs go that route, it may finally pique developer interest in taking advantage of these accessories. In much the same way, I think Apple needs an iPad Pro to get developers to take an interest in productivity. In my opinion, this may be the only way to meaningfully increase tablet penetration in the enterprise.
This story was reposted with permission from tech-thoughts.
 Sameer Singh is an M&A professional and business strategy consultant focusing on the mobile technology sector. He is founder and editor of tech-thoughts.net.
 -

Windows 10: Needed, but business model challenges remain
Publié: octobre 2, 2014, 7:40pm CEST par Sameer Singh
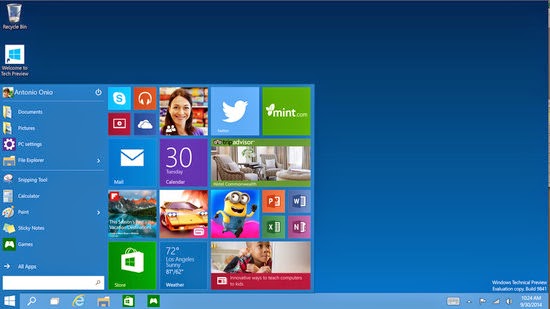
This week, Microsoft unveiled a long-awaited update to its operating system -- officially dubbed, Windows 10. Microsoft says that Windows 10 is an attempt to create a single operating system that works across phones, tablets and PCs, without the compromises that were visible in Windows 8. This is certainly a much needed update that should help them retain their core customer base, but it also doesn't do much to cover up their biggest weaknesses.
First, let's point out the obvious. Microsoft's decision to skip a version number is curious. While Microsoft claims it was because Windows 10 was a "leap" forward, it is clearly an attempt to clear away the hostility faced by Windows 8, especially among enterprise users -- Microsoft's most important customers.
While Windows 8 attempted to fuse two entirely different operating systems (and interaction models) together, Windows 10 seems to select the interaction model most suited to the available hardware. As a result, desktop users (and more importantly, enterprise customers) are no longer forced to deal with a touchscreen interface. It is these customers that Windows 10 is targeted at. This is certainly good news, but it only targets users at the very top of the computing pyramid. Of course, this top tier is defensible as long as the tablet's upmarket mobility remains limited. But lower tiers of computing remain a major challenge for Microsoft.
At lower tiers of the computing pyramid (mainly characterized by consumption, not productivity), Microsoft still faces two major business model challenges. The first is that Microsoft's primary monetization model, software licensing, is no longer feasible. Android has become the de-facto standard for mainstream tablets/smartphones and is available for free. In response, Microsoft made Windows free for devices with screen sizes of nine inches or below. This may seem like an arbitrary cut-off, but it highlights a clear delineation between Microsoft's core and non-core markets (as they see them today). Microsoft has been unsuccessful at monetizing consumer services, so the goal of this move may be more subtle.
My guess is that Microsoft is attempting to subsidize Windows at lower tiers in the hope that it helps defend Windows at higher tiers. The thought is that a Windows phone or tablet user may be more inclined to remain within the Windows ecosystem. This brings us to the second challenge -- Windows doesn't really have a cohesive ecosystem. The app ecosystem Windows phones/tablets is sparse and that limits its appeal to a niche, price-sensitive segment and one that is unlikely to be valuable to Microsoft at higher computing tiers. The ecosystem for a Windows PC consists of very few applications or services that are valuable on a smaller Windows-specific device. As a result, the value of staying "within the Windows ecosystem" across computing tiers is very limited. As of today, these challenges don't pose an existential threat to Microsoft but that may not always be the case. To their credit, Microsoft seems to recognize this. Satya Nadella's emphasis on cross-platform productivity suggests as much.
This story was reposted with permission from tech-thoughts.
 Sameer Singh is an M&A professional and business strategy consultant focusing on the mobile technology sector. He is founder and editor of tech-thoughts.net.
 -

Smartphone market share and usage by country
Publié: septembre 20, 2014, 9:30am CEST par Sameer Singh
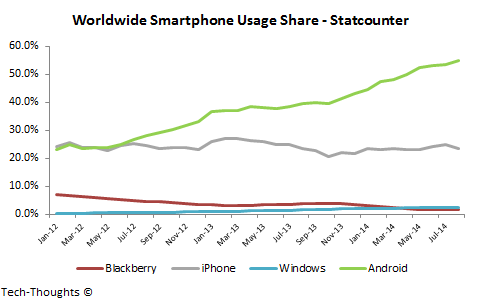
With the arrival of the iPhone 6 (and 6 Plus), this may be a good time to review smartphone market share and usage share trends around the world. As these data points reflect the tail end of the iPhone's product cycle, we should expect a market share bounce over the coming months. On the other hand, movements in usage share are unlikely to be as sharp.
As always, market share data is sourced from Kantar and usage share data is from Statcounter. My rationale for using these particular metrics was laid out in my last post on the topic:
Because of the regionally fragmented nature of distribution, some view global market share figures with cynicism. My argument was that market share patterns by country could give us a better understanding of these trends. While market share of shipments is certainly a leading indicator for install base (and consequently, usage), it only gives us a part of the story. Contrasting regional market share and usage share (as a proxy for install base) may give us an even better understanding.
Usage share (or browsing share) isn't an ideal proxy for install base as it could be skewed towards higher end devices. However, trends in usage share could give us a fairly good understanding of the underlying install base.
While this is only helpful for countries where both sets of data points are available, there are few major markets that are excluded (India and South-East Asia being notable exceptions). Now, here are the metrics for each country.
The Big Two
US: Android Hits New High Ahead of iPhone 6 Launch
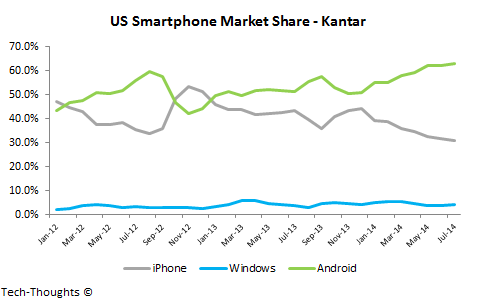
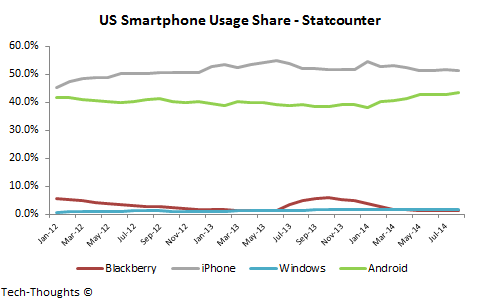
As expected, the iPhone saw a cyclical decline ahead of the iPhone 6 launch. But the chart also shows that the iPhone's market share began declining YoY in late-2013. This suggests that T-Mobile's and AT&T's unsubsidized "value plans" have had some impact. This combination of factors has led to Android hitting an all-time high in both market share and usage share. The iPhone 6 launch will certainly have an immediate effect on this trend. It will be interesting to watch the scale of this impact.
China: Lucrative Market for iPhone, Android Dominates Volumes
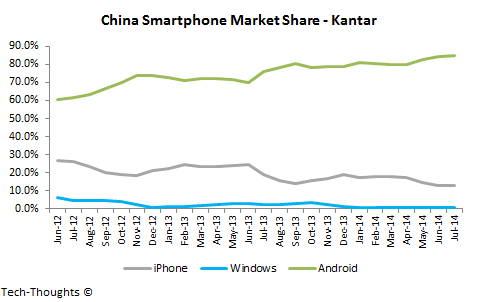
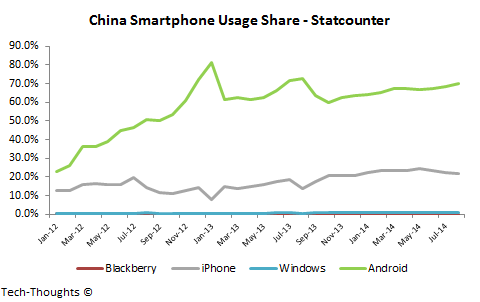
In terms of pure volume, the Chinese market has been dominated by Android (or AOSP, as some prefer to call it) for years. Of course, China is the largest smartphone market in the world by such a large margin here that it is lucrative to even be a niche player here. This brings us to the iPhone -- The iPhone has continued to lose market share to Android, mainly because of massive volume growth at lower price points. However, both the iPhone and Android have increased usage share at the expense of legacy platforms like Symbian. The iPhone has seen a notable drop in market share and usage over the past few months, but this came at the end of the iPhone 5S product cycle.
Europe
UK: Android Usage Continues to Climb
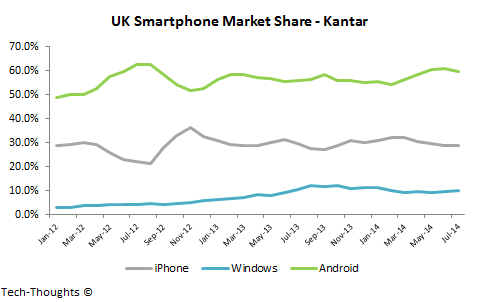
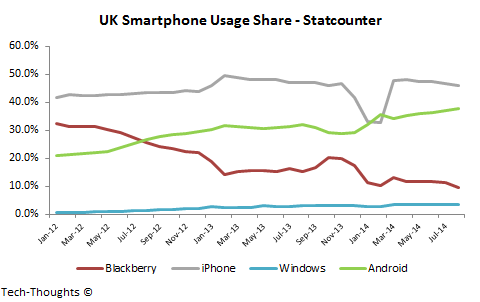
Over the last few years, the UK has been one of the most predictable markets in the world in terms of market share. It is one of the iPhone's strongest markets across the globe and is quite cyclical as a result. Usage share, however, is a different story. The iPhone's usage share has remained roughly flat over the past couple of years. Meanwhile, Android has seen its usage share double over the same time frame. I have to wonder if this has been caused by increased uptake of high-end Android devices or an outcome of increasing quality at lower price points. We should be able to figure this out based on the impact of large screened iPhones.
Germany: Business as Usual
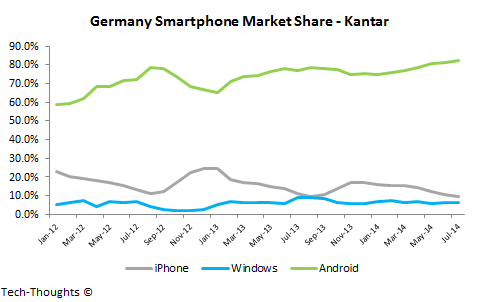
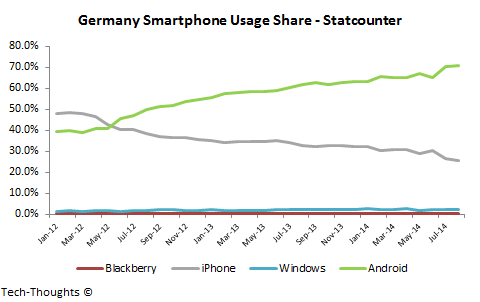
The charts paint a pretty clear picture. No explanation necessary. The iPhone 6 launch should tell us if this is purely driven by screen size or if there are other factors at play.
France: iPhone Sees Cyclical Decline, Windows Phone Remains Alive
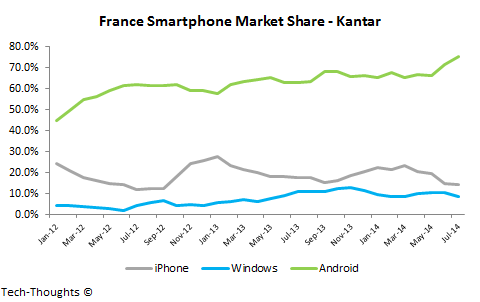
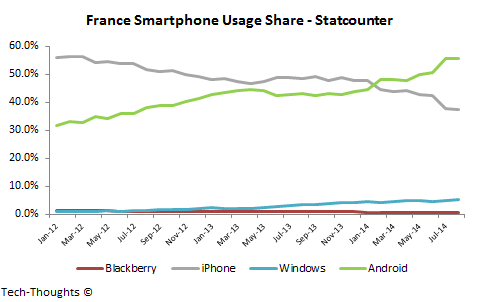
The iPhone has seen a notable decline in market share over the last few months, owing to the upcoming iPhone 6 launch. Interestingly, Android's usage share overtook the iPhone's in Q1 of this year, after the iPhone 5S launch. Large screened devices typically encourage more browsing, so it will be interesting to watch the impact of the iPhone 6 and 6 Plus. This has also been one of the few markets where Windows Phone shows up on both the market share and usage share charts. While its market share performance has fluctuated, its usage finally cracked the 5% mark.
Italy: Android Leads, Followed by iPhone and Windows Phone
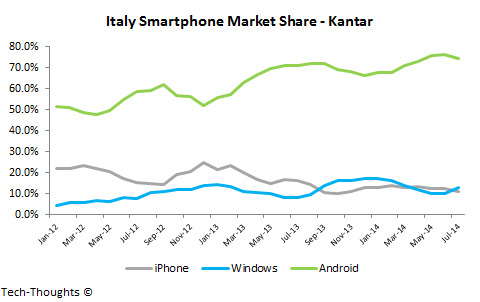
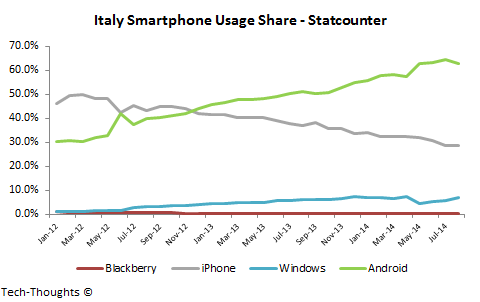
The iPhone has never been a particularly strong player in Italy, but it is interesting to see the lack of a pre-launch decline. Android has dominated market share for a few years now, but Windows Phone appears to be staying alive at the ~10% range. In August, it even managed to chip into Android's usage share lead, which is no small feat for a third player. That said, both market share and usage share patterns suggest that this may be Windows Phone's ceiling.
Spain: Germany Revisited
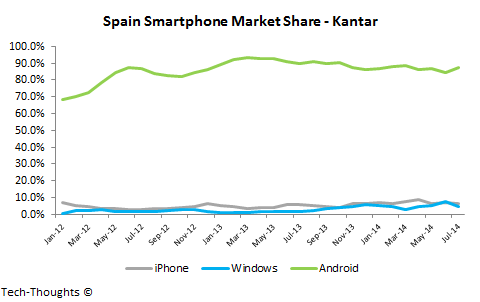
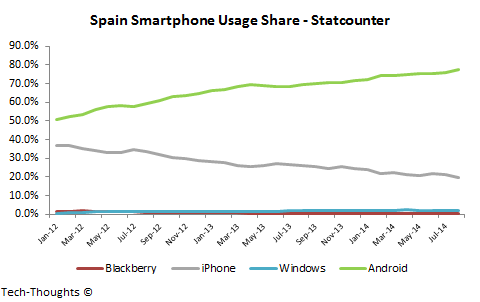
Again, these charts tell the story.
Australia & Japan: Cyclicality Rules the Day
Australia
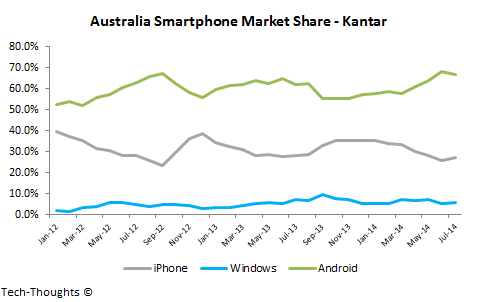
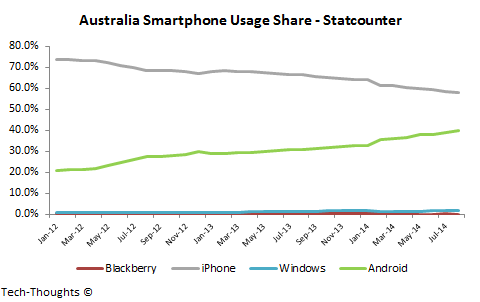
As in the UK, market share patterns in Australia have remained stable for a couple of years now. As with any other iPhone stronghold, market share is incredibly cyclical. Interestingly, the usage share chart couldn't be more different as Android's share has doubled at the expense of the iPhone. This is another market to watch to gauge the impact of large screened iPhones.
Japan
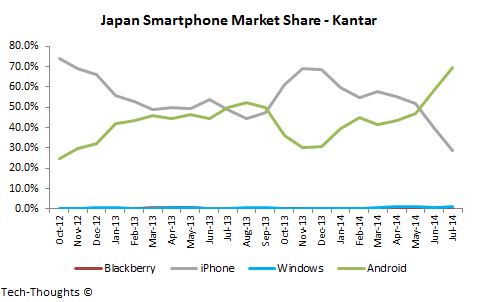
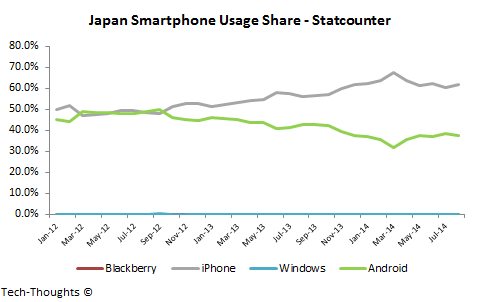
Japan is one of the iPhone's strongest markets. It is also the most cyclical and most predictable market on this list. This isn't very surprising given that carriers dominate distribution and maintain opaque pricing. Consequently, the iPhone's peak market share and usage share have grown with the number of distribution partnerships with carriers.
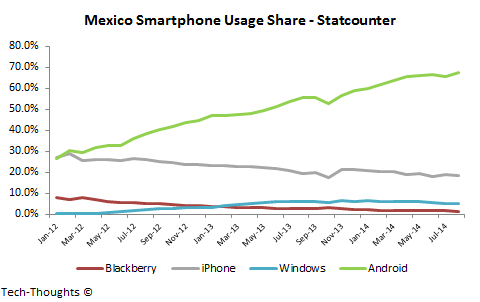
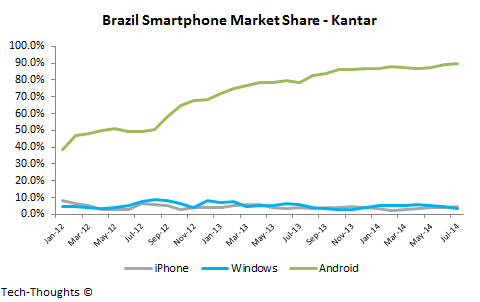
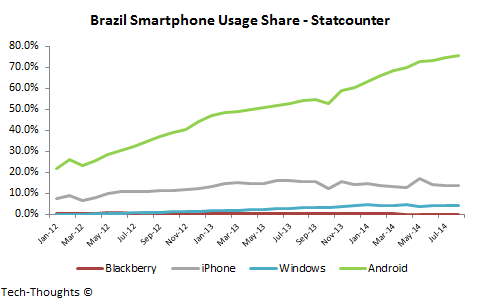
Latin America: Android Territory
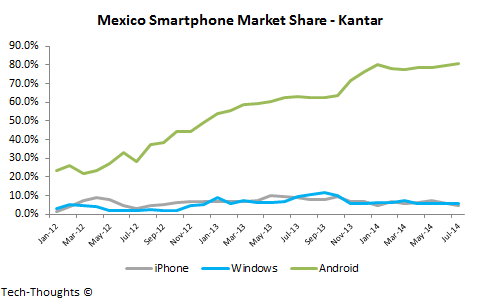
Again, the charts tell the whole story in Latin America. Both market share and usage share patterns are remarkably consistent across countries.
Mexico
Brazil
Argentina
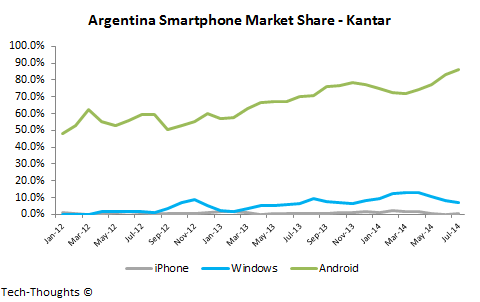
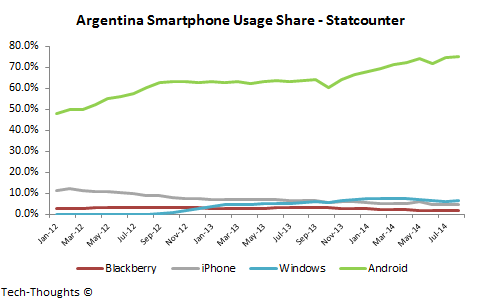
Photo Credit: glossyplastic/Shutterstock
This story was reposted with permission from tech-thoughts.
 Sameer Singh is an M&A professional and business strategy consultant focusing on the mobile technology sector. He is founder and editor of tech-thoughts.net.
 -

Uber, self-driving cars and Google
Publié: septembre 6, 2014, 1:30pm CEST par Sameer Singh

This is a topic I've briefly discussed on Twitter and then again on Bernard Leong's podcast, but I think it deserves a deeper look. Many are excited about the potential of Uber integrating with self-driving cars. But in my opinion, self-driving cars could be disruptive to Uber's current business model. Let's take a look at a few facets of Uber's business model and gauge the potential impact of Google's self-driving cars.
As I've mentioned previously, Uber is a platform that connects transportation providers (or drivers) with potential customers. Self-driving cars completely remove drivers from this equation and could force Uber to own and manage their own fleet. With their current model, Uber operates with "zero capex" and their marginal cost for adding supply is effectively zero. But by owning self-driving cars, this marginal cost becomes a meaningful amount, i.e. the cost of each vehicle. With this revised cost structure, the value of Uber's business model changes completely.
Of course, taxi companies and other logistics firms could potentially acquire self-driving cars and use Uber to recoup their investment. This could retain the character of Uber's business model. But as Mark Miller mentioned on Twitter, entrenched interests like unions could prevent that.
All things considered, Google's self-driving cars seem to be a real threat to Uber. How does this play into Google Ventures' investment into Uber? In my opinion, Google's investment is a hedge against the regulatory risks faced by self-driving cars. With self-driving cars, Google's vision is to make transportation as easy as an online service and reduce car ownership (this also gives people more time to use Google services). In many ways, Uber accomplishes the same goal but it also has bigger plans to disrupt the logistics industry.
Image Credit: iQoncept / Shutterstock
This story was reposted with permission from tech-thoughts.

Sameer Singh is an M&A professional and business strategy consultant focusing on the mobile technology sector. He is founder and editor of tech-thoughts.net.
-

Amazon's Fire Phone is a puzzle
Publié: juin 19, 2014, 6:11pm CEST par Sameer Singh
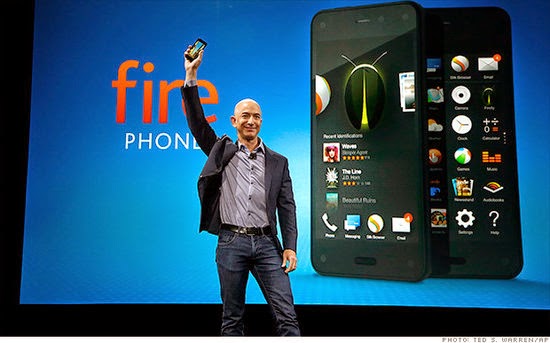
I've gone back and forth on the prospects for Amazon's smartphone, and yesterday's launch of the Fire Phone hasn't really helped me make up my mind. Apart from the heavily rumored 3D interface, most of what Amazon announced was a surprise to me. It's difficult to ignore the fact that Amazon holds some distinct advantages, but there are also certain areas where they seem to be fighting an uphill battle.
Amazon's Challenges: Pricing and Dynamic Perspective
Let's begin with the obvious, the pricing. Amazon's pricing strategy for the Fire Phone is very similar to those of other premium smartphones -- $650 unsubsidized and $199 on contract. This is especially curious given that the device is exclusive to AT&T, a carrier that has made it a priority to shift to unsubsidized, financing plans. Of course, it's entirely possible that Amazon has given AT&T a subsidy waiver. In this case, the potential of Prime users on heavy data plans could be considerably attractive to AT&T. But this is just speculation on my part.
Another challenge is that the Fire Phone's heavily emphasized differentiator (the 3D interface or Dynamic Perspective as Amazon calls it) may not be much of a differentiator at all. The Fire Phone's market penetration is unlikely to be high enough to spur a large number of developers to leverage it in a meaningful way. This would limit the value of Dynamic Perpective to the device's UI. For the sake of argument, let's assume that consumers find it valuable. This is by no means a given, but if it does happen, what stops other premium OEMs like Apple and especially Samsung from using this feature?
Amazon's Advantages: Mayday and Firefly
The Fire Phone certainly faces a host of challenges, but it holds some distinct advantages as well. The first is Mayday, Amazon's one-tap access to customer service (via video chat). Amazon's customer service is really unparalleled and there are few companies (if any) that could attempt to offer a 24-hour video chat service with a 15 second response time. This could be very useful for technology laggards and first time smartphone buyers. However, this proposition would have been far more valuable if the pricing strategy catered to that segment.
Firefly is another interesting feature that will be difficult for other firms to replicate. It is effectively a camera-driven, real-world search engine which hooks into Amazon. In other words, a customer could look at a product in a physical store and buy it on Amazon within a few seconds. In a way, it attempts to use Amazon's product range and credit card database to make mobile payments unnecessary.
The primary goal of the Fire Phone is to support Amazon's e-commerce business model and this partly explains why Amazon went the premium route -- Premium smartphone buyers are likely to make more online/offline purchases. However, high-income customers can only use Firefly if they end up buying the phone.
This story was reposted with permission from tech-thoughts.
 Sameer Singh is an M&A professional and business strategy consultant focusing on the mobile technology sector. He is founder and editor of tech-thoughts.net.
 -

Surface Pro 3: niche product, not a savior
Publié: mai 22, 2014, 4:11pm CEST par Sameer Singh
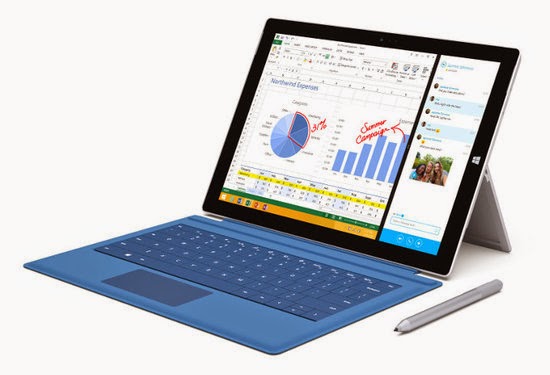
This week, Microsoft unveiled the Surface Pro 3 with a larger, 12 inch display and surprised some by holding off on a "Surface Mini". While Microsoft continued to harp on their "best of both worlds" mantra, it was very clear that this device was focused on productivity use cases and enterprise users. Does this signal a new era in tablet computing or is this simply a niche product?
I recently downgraded my tablet sales estimate because tablets haven't encroached upon productivity use cases as quickly as "phablets" have encroached on consumption use cases. So wouldn't the Surface Pro 3 fit with my definition of upmarket movement? Not quite. The challenge for tablets is to move upmarket into productivity use cases without compromising on their advantages over PCs -- 1) ease of use, and 2) lower price points. With the Windows 8 operating system and a price tag starting at $930 (incl. the keyboard cover), the Surface Pro 3 misses on both points.
The primary selling point of the Surface is access to legacy applications which are practically unusable without the keyboard cover (the fact that this is still sold as an optional accessory is puzzling). In other words, the Surface is not a tablet, but an ultraportable PC or "ultrabook" which happens to have a touchscreen. The product has been designed to cater to a very niche segment of enterprise users, i.e. users who have already decided to purchase a portable PC over a tablet. This leaves no room to move upmarket and no flexibility to move downmarket. The sub-par mobile app ecosystem for Windows Phone/RT limits downmarket movement as well.
That said, focusing on enterprise PC users may be a conscious decision by Microsoft. The lack of a "Surface Mini" announcement tells me that Microsoft is beginning to understand their position in the mobile industry. This strategy is unlikely to be a major success, but could drive just enough sales to keep the product line alive.
This story was reposted with permission from tech-thoughts.
 Sameer Singh is an M&A professional and business strategy consultant focusing on the mobile technology sector. He is founder and editor of tech-thoughts.net.
 -

Unfair comparisons: Google and Facebook vs. messaging apps
Publié: avril 21, 2014, 6:24pm CEST par Sameer Singh
This weekend, I came across an interesting post by Benedict Evans on "unfair but relevant" comparisons. While I agreed with everything he said, his focus was entirely on the hardware side of the equation. It may be just as relevant to compare today's hot mobile services to online service start-ups from the PC era.
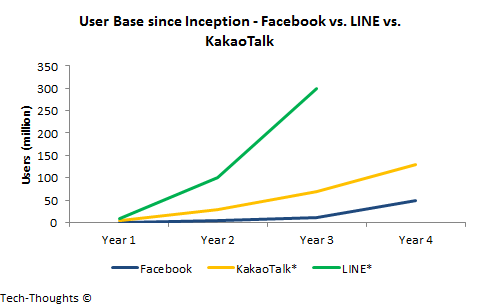
The chart above compares the growth of Facebook's user base, since inception, to that of KakaoTalk and LINE. One disadvantage here is that we can only compare registered users for messaging apps to active users for Facebook. According to one estimate, 61 percent of LINE's registered users are active. If this proves roughly accurate for major messaging apps, KakaoTalk and LINE would still overshadow Facebook's user growth by a considerable margin. This is because PC-era start-ups like Facebook and Google operated in a much smaller playground as compared to today's mobile start-ups. But the "scale of mobile" has already been beaten to death. Does that necessarily mean that these companies also make more money?
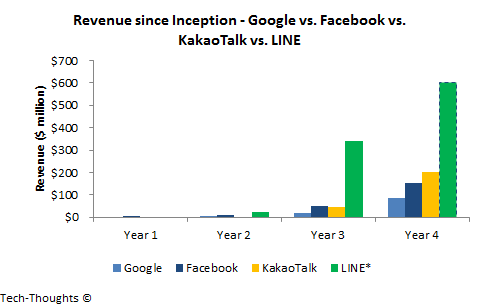
Now this is interesting. The chart above compares the revenue figures for Google, Facebook, KakaoTalk and LINE over their first four years of operation, starting from 1998, 2004, 2010 and 2011 respectively. Revenue figures for Google and Facebook have been sourced from their respective IPO prospectuses, while those for LINE and KakaoTalk are from company press releases. For LINE, I've taken a conservative estimate for Year four (2014) revenues by assuming average quarterly revenues of $150 million, 25 percent higher than its Q4 2013 revenue. In comparison, LINE's average quarterly revenue in 2013 was roughly 300 percent higher than its Q4 2012 revenue. All revenue figures for KakaoTalk and LINE are net of payments to developers and partners.
Over their first four years of operation, KakaoTalk and LINE have outpaced the revenue generated by both Google and Facebook. This is especially significant given that KakaoTalk is still considered a regional player. LINE, while smaller than Whatsapp, is more diversified geographically and dwarfs Google's and Facebook's early revenue performance. As it turns out, the playground isn't just larger, it's also better.
This story was reposted with permission from tech-thoughts.
Photo Credit: Violet Kaipa / Shutterstock
 Sameer Singh is an M&A professional and business strategy consultant focusing on the mobile technology sector. He is founder and editor of tech-thoughts.net.
 -

Amazon Fire TV: Business model motivations
Publié: avril 3, 2014, 4:40pm CEST par Sameer Singh
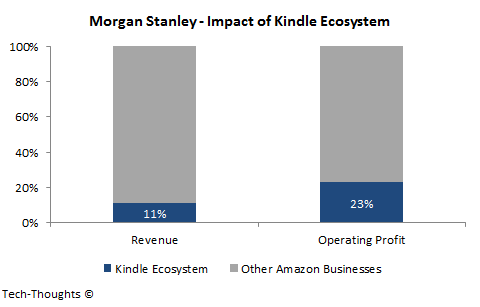
23 percent -- That figure alone explains Amazon's goal for Fire TV. In 2013, it was estimated that the Kindle ecosystem was responsible for 11 percent of Amazon's revenue, but 23 percent of its operating profit. However, the revenue numbers also include $4.5 billion in Kindle device sales (6 percent of Amazon's revenue) which were sold at breakeven. This means that 23 percent of Amazon's operating profit came from a business that accounted for just 5 percent of its annual revenue.
Given the figures above, it is no surprise to see Amazon double down on its "razors and blades" strategy. By selling a low-cost ($99) box to consumers, Amazon gains access to a distribution channel for high-margin content sales. Amazon seems to have realized that this box would only appeal to consumers if it also provides access to third-party services like Netflix, Hulu, etc. (much like Kindle Fire tablets and third party apps). But more importantly, it also seems to be expanding its presence in the digital content business via Amazon Game Studios.
As Fire TV gets the Kindle ecosystem into living rooms, games become a natural extension for their business model. After all, games are typically one of the most popular and profitable segments within this business.
How is this different from Apple TV's business model? In general, Apple's business model relies on content to make their devices more attractive to consumers. Unless Apple's content offering and interaction model can be far superior to those of competitors like Fire TV, it is difficult to see device prices (and margins) improving in this category. This is why Apple TV remains a "hobby" to this day.
The post was republished with permission from tech-thoughts.net
 Sameer Singh is an M&A professional and business strategy consultant focusing on the mobile technology sector. He is founder and editor of tech-thoughts.net.
 -

The real threat to Google's business model
Publié: mars 17, 2014, 4:55pm CET par Sameer Singh
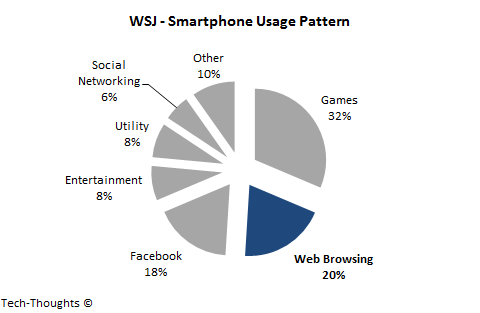
With Google's stock price hovering near all-time highs, the risks to its business model have become a hot button topic among industry observers. The dramatic shift to mobile computing has the potential to upend every single company and industry. However, few seem to understand Google's business model well enough to gauge its risks. Let's take a look at some oft-repeated arguments and compare them to the real risks facing Google.
Let's begin by explaining Google's business model -- the best explanation I've seen comes from VisionMobile:
Let’s explore the three pillars of Google’s strategy that enable the company to sell more ads for more money. Google increases its reach by flattening any obstacle that stands between its ads and eyeballs. Then, Google expands its visibility to the user by providing services, creating more opportunities to show ads. Finally, the company squeezes the maximum out of those opportunities by mining user data, which allows them to understand and target users very efficiently.
This pattern explains practically all of Google's initiatives, from Android to Google X projects to the Nest acquisition. Now, let's take a look at the frequent arguments against Google's business model and its real risks.
Forked Variants of AOSP
One popular theory among industry observers is the threat of Android forking, i.e. a large technology firm could fork AOSP and replace Google services / APIs with its own. The point to understand here is that AOSP is not a threat to Google, but a cost of dominating the mobile landscape. It only becomes a threat if AOSP can be forked and combined with an ecosystem (services + app store) that is comparable to Google's. AOSP variants that exist today (Kindle Fire, Nokia X, Chinese builds) do not necessarily meet this criteria. Of course, forking Android may be beneficial to companies like Amazon and maybe even Microsoft if it plays its cards right, but it doesn't really constitute a measurable threat to Google's business model.
A more recent theory is that secondary ecosystems, i.e. messaging apps, could fork AOSP to build their own platform. The problem with this theory is that forking AOSP doesn't really accomplish much for a messaging app because of the following:
- Very little overlap with popular Google services (search, maps, email). Of course, social is one of Google's weak points and it would love to get its hands on a messaging app.
- Leading messaging apps already have access to a massive, highly engaged user base, with strong network effects. Therefore, the incremental benefit from owning its own smartphone platform is likely to be minimal. This isn't necessarily true for businesses where user engagement isn't a given (e.g.: Amazon).
- Owning its own smartphone platform will not help messaging apps poach users from direct competition -- Would a LINE or Whatsapp user buy a WeChat-only phone?
- Monetization opportunities will not necessarily change on a proprietary platform built on forked AOSP -- if you look closely at their respective strategies, the goal is to leverage existing platforms and build valuable, monetizable services on top.
Of course, this does not mean that messaging apps would never release a branded smartphone -- in fact, that may be a very effective channel to increase word-of-mouth and distribution reach. But they really have no motivation to fork AOSP. It's an unnecessarily complex process with little to no incremental benefit.
Slowing Internet Population Growth & the Integrated Hardware Model
This is a popular theory proposed by some analysts from the devices / hardware industry. It states that Google's revenues are highly correlated with the global internet population (with flat ARPU). The assumption is that Google's revenue growth will slow or decline if it does not switch to a Apple-like business model based on integrated hardware. I've already explained why this isn't the case, but it bears repeating:
One pattern commonly used to support these theories is that Google's revenue is highly correlated with the global internet population. The problem with that pattern is that it is almost entirely based on data from the personal computing era. Until mobile browsing reaches critical mass, we will have no knowledge of how this pattern will evolve. Therefore, assuming a flat ARPU isn't necessarily a good assumption when the underlying factors are no longer constant. This is especially true when we take into account the fact that Google has still not implemented any monetization strategies for mobile-focused services like Google Now. Google's business model will certainly force it to explore novel ways of monetizing these mobile services. Unfortunately, operating independent hardware companies will not be one of them.
Google's Real Threat: Closed App Data
The chart at the top of this post shows the split of smartphone usage by task. Web browsing only forms 20 percent of smartphone usage while is mostly allocated to mobile apps. As I explained at earlier in this post, Google's business model is built on mining data on user activity. On smartphones, Google certainly has access to browsing and location data, but has no access to activity within apps.
As of today, the only companies that have access to app usage data are -- 1) the app publishers themselves, and 2) Google's biggest competitor, Facebook. Facebook collects data through login / news feed integration with up to 200,000 apps. So far, Facebook has chosen to monetize this data using mobile app install ads, but there could be many other ways.
As app usage continues to surge, search (even contextual search like Google Now) may become less relevant which could threaten Google's advertising revenue. Google's recent initiatives like Google Play Games aim to sync game data and achievements across devices. But the real goal of these initiatives is to gain access to currently closed user data (Games have the largest share of usage on smartphones). In addition to this, Google has also launched an initiative to crawl in-app content and deep-linking search results. At present, Google has relied on deals with individual developers to examine app content. The lack of a scalable option to index app content could certainly be a major risk to its business model.
Image Credit: Stuart Miles/Shutterstock
The post was republished with permission from tech-thoughts.net
 Sameer Singh is an M&A professional and business strategy consultant focusing on the mobile technology sector. He is founder and editor of tech-thoughts.net.
 -

Nokia's swan song
Publié: janvier 24, 2014, 6:02pm CET par Sameer Singh
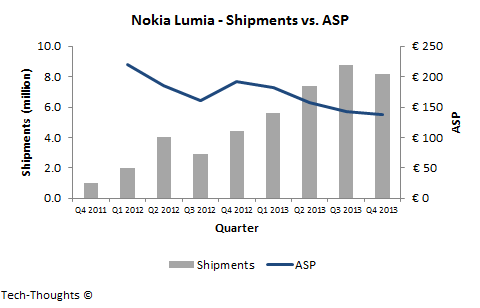
Yesterday, Nokia posted its final financial results before the Microsoft deal closes. Unfortunately, the part of Nokia being sold to Microsoft doesn't seem to be in great shape. Nokia's recent traction with the Lumia range seems to have stalled as it announced a 7 percent sequential decline in unit sales. Let's take a brief look at the causes of the decline and what Microsoft is really buying.
The chart above shows Lumia shipments and ASPs for the past eight quarters. As we can see the Lumia's ASP (Average Selling Price) has continued to decline as shipments grew. This reinforces the fact that the Lumia sales mix was dominated by low-end variants -- primarily the Lumia 520. We need to keep this in mind while examining the cause of the Q4 decline in shipments.
Cause of the Decline: Competition, Not Brand Sentiment
Some analysts have suggested that the announcement of the Microsoft acquisition affected brand sentiment, which caused this decline. The problem with this line of reasoning is that it is limited to well-informed, high-end consumers. While this may certainly be true, these customers could not have constituted a meaningful proportion of Lumia sales -- certainly not large enough to cause a 7-percent decline in a holiday quarter. The ASP decline in Q4 was also in line with previous quarters and not significant enough to suggest a sudden change in the sales mix. The most likely cause of this decline was increasing price competition from mid-tier and low-end vendors in the increasingly commoditized smartphone space.
Windows Phone Outlook
The change in brand sentiment may not have been a big factor in Q4, but it will become a major factor going forward. Nokia's brand is still the primary reason for the competitiveness of low-end Lumia devices against increasingly aggressive mid-tier and regional vendors. After the Microsoft acquisition closes, the loss of the "Nokia" brand is likely to have a significant impact on Lumia sales. Keeping in mind the increase in price competition, this acquisition doesn't quite look like a recipe for success.
The post was republished with permission from tech-thoughts.net
 Sameer Singh is an M&A professional and business strategy consultant focusing on the mobile technology sector. He is founder and editor of tech-thoughts.net.
 -

Verizon results hint at weak US iPhone sales
Publié: janvier 22, 2014, 7:12pm CET par Sameer Singh
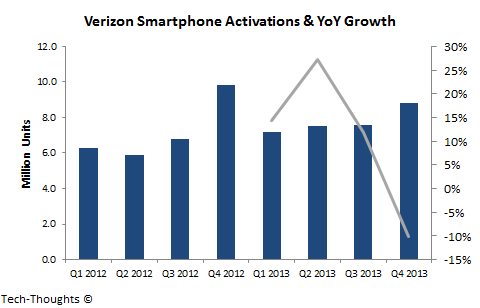
Yesterday, Verizon reported that it activated 8.8 million smartphones in Q4 2013, a 10 percent decline from the 9.8 million it activated in Q4 2012. While it declined to break out iPhone activations, we do have some data that could help us gauge the iPhone's sales performance in the US market.
The reason for the decline in Verizon's smartphone activations should be clear enough to regular readers. As smartphones have "good enough", replacement cycles have become longer. At the same time, the basis of competition in the market has shifted towards affordability and flexibility, which explains the popularity of T-Mobile's unsubsidized plans. Now, let's make an attempt to gauge how this decline affected iPhone sales at Verizon.
Kantar Estimates vs. iPhone Activations Reported by Verizon
Earlier this month, Kantar's survey showed a decline in the iPhone's market share at all major US carriers. Unfortunately, Kantar's survey only covered sales over 3 months ending in November 2013. However, this seems to be the only data point we have access to at the moment.
In order to gage the relevance of this data, I plotted the quarterly iPhone activation share reported by Verizon against Kantar's iPhone sales share estimates at Verizon from the prior month, i.e. Q2 2013 vs. 3 months ending May 2013, Q3 2013 vs. 3 months ending August 2013, etc.
The chart below shows the correlation between the two data sets.
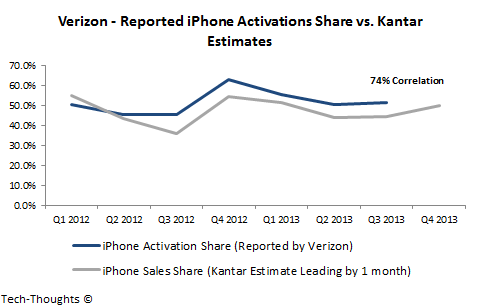
Both data sets seem to be consistent with each other, without any major outliers. Based on this, Verizon's Q4 2013 iPhone activations should make up roughly 58 percent of all smartphone activations or 5.1 million units. This is an 18 percent decline from Q4 2012, when Verizon posted 6.2 million iPhone activations (~63 percent of all smartphone activations).
Based on Kantar's data, the iPhone's sales share has declined at all other carriers as well, which brings up the possibility of a significant YoY decline in US sales. This is also consistent with data from Google Trends.
Even though the iPhone 5s has continued to sell well, sales of lower-end iPhone models may have been pressured because of the change in pricing dynamics. In order for the iPhone to see sales growth in calendar Q4, these declines will need to be offset by growth in Japan (DoCoMo addition) and China (faster roll-out).
This story was reposted with permission from tech-thoughts.
 Sameer Singh is an M&A professional and business strategy consultant focusing on the mobile technology sector. He is founder and editor of tech-thoughts.net.
 -

Why Apple needs an iPad Pro
Publié: janvier 3, 2014, 11:57am CET par Sameer Singh
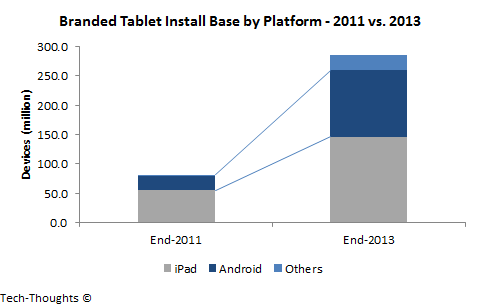
I have previously explained the concept of tablet market tiers and the pattern of upmarket competition among Android vendors as they continue to fight for reasonable hardware margins.
Recent tablet install base data from ABI research seems to support this hypothesis and describes the same pattern we saw in the smartphone market. This also helps explains why Apple needs an iPad Pro.
First Time vs. Repeat Buyers
In the chart above, the tablet install base data for 2013 is from ABI. I've estimated 2011 data by using Transparency Market Research's 81.2 million figure for the total install base and IDC's 2010 & 2011 tablet shipment estimates to get a platform split. The data clearly shows the explosion in tablet ownership, with Android growing faster.
Now, compare this data, with the chart below:
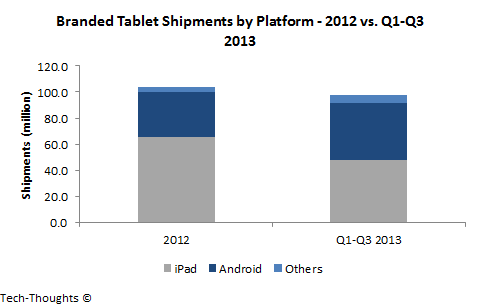
The chart above shows IDC's reported branded tablet shipment estimates from 2012 to Q3 2013, i.e. the time frame between the two install base measurements shown in the first chart. While we're missing one quarter of data (Q4 2013), it is obvious that the growth disparity between the iPad and Android tablets is smaller. Based on this pattern, it seems that iPad sales are being driven by repeat buyers, while Android tablet sales are being driven by first time buyers.
The Need for an iPad Pro
Now compare this pattern with the tablet market tiers in the figure below (Keep in mind, these tiers are based on usage patterns and not on price):

Each lower market tier is successively larger and with lower penetration than the previous one. Branded Android tablets entered the large mid-tier market with "good enough" offerings that prevented the iPad from making a downmarket move. As a result, even the lower priced iPad Mini primarily catered to repeat buyers and cannibalized iPad sales instead of increasing the size of Apple's potential market. This explains the rapid drop in the iPad's shipment growth over the last year.
Now, what would happen when branded Android tablet vendors make a concerted upmarket push? This is inevitable because branded vendors are facing increasing margin pressures from regional brands and white box competitors in mid-market tiers. Increasing competition in the limited high-end market could cause iPad shipments to flat-line or even decline over the next few years. In response, Apple is likely to aggressively target the only market tier remaining above -- the enterprise. There is a reason iPad Pro rumors have been gaining steam.
Photo Credit: 1000 Words
This story was reposted with permission from tech-thoughts.
 Sameer Singh is an M&A professional and business strategy consultant focusing on the mobile technology sector. He is founder and editor of tech-thoughts.net.
 -

Why Apple needs an iPad Pro
Publié: janvier 3, 2014, 11:57am CET par Sameer Singh

I have previously explained the concept of tablet market tiers and the pattern of upmarket competition among Android vendors as they continue to fight for reasonable hardware margins.
Recent tablet install base data from ABI research seems to support this hypothesis and describes the same pattern we saw in the smartphone market. This also helps explains why Apple needs an iPad Pro.
First Time vs. Repeat Buyers
In the chart above, the tablet install base data for 2013 is from ABI. I've estimated 2011 data by using Transparency Market Research's 81.2 million figure for the total install base and IDC's 2010 & 2011 tablet shipment estimates to get a platform split. The data clearly shows the explosion in tablet ownership, with Android growing faster.
Now, compare this data, with the chart below:

The chart above shows IDC's reported branded tablet shipment estimates from 2012 to Q3 2013, i.e. the time frame between the two install base measurements shown in the first chart. While we're missing one quarter of data (Q4 2013), it is obvious that the growth disparity between the iPad and Android tablets is smaller. Based on this pattern, it seems that iPad sales are being driven by repeat buyers, while Android tablet sales are being driven by first time buyers.
The Need for an iPad Pro
Now compare this pattern with the tablet market tiers in the figure below (Keep in mind, these tiers are based on usage patterns and not on price):

Each lower market tier is successively larger and with lower penetration than the previous one. Branded Android tablets entered the large mid-tier market with "good enough" offerings that prevented the iPad from making a downmarket move. As a result, even the lower priced iPad Mini primarily catered to repeat buyers and cannibalized iPad sales instead of increasing the size of Apple's potential market. This explains the rapid drop in the iPad's shipment growth over the last year.
Now, what would happen when branded Android tablet vendors make a concerted upmarket push? This is inevitable because branded vendors are facing increasing margin pressures from regional brands and white box competitors in mid-market tiers. Increasing competition in the limited high-end market could cause iPad shipments to flat-line or even decline over the next few years. In response, Apple is likely to aggressively target the only market tier remaining above -- the enterprise. There is a reason iPad Pro rumors have been gaining steam.
Photo Credit: 1000 Words
This story was reposted with permission from tech-thoughts.
 Sameer Singh is an M&A professional and business strategy consultant focusing on the mobile technology sector. He is founder and editor of tech-thoughts.net.
 -

Examining China Mobile iPhone estimates
Publié: décembre 23, 2013, 7:53pm CET par Sameer Singh
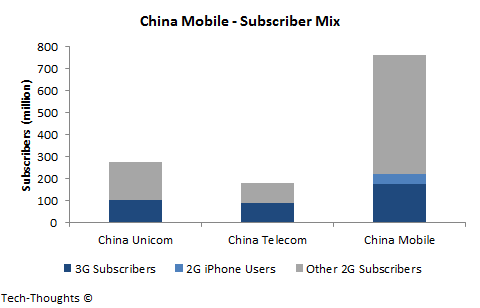
Today, Apple and China Mobile finally announce a distribution partnership that had been heavily rumored for months. While the deal to sell iPhones through China Mobile isn't surprising, the wild variation in analyst estimates is. Let's take a look at a few wrinkles that may be playing havoc with these estimates.
The easiest numbers to find on Chinese carriers are usually subscriber details. The chart above shows the 2G/3G subscriber mix on the three major Chinese carriers. Therefore, the details that analysts typically use to base sales estimates are -- subscriber base, 3G subscriber base and number of unlocked iPhones (2G) on the network. For China Mobile, these figures are 759 million, 176 million and 45 million respectively. Bernstein Research's survey also shows that some China Mobile subscribers use smaller carriers for data service, so these subscribers may have been excluded from these estimates. Analysts are also aware that China Mobile does not offer mobile number portability -- given the status granted by specific blocks of numbers, some analysts may have assumed a major sales impact.
However, there are much more important factors at play in the Chinese market, which analysts have certainly not taken into account. We can use the identity-utility concept to explore this further. We already know that the proportion of identity-focused customers in China is far higher than in markets like the US and Europe. This is caused by the subsidized pricing structure in China that mandates full upfront payment, with subsidies given out in the form of monthly refunds.
Among China Mobile subscribers, the value of identity granted by the iPhone is so high that 45 million subscribers use iPhones on dated 2G networks. It should be obvious that the degree of overlap between, one: identity-valuing 2G iPhone users, and two: subscribers that value the prestige associated with certain number blocks, is likely to be very high. This implies the lack of mobile number portability on China Mobile may not have a major impact on iPhone sales.
Therefore, the bulk of China Mobile's iPhone sales will be driven by customers who -- one: value the ownership of an iPhone, two: value the utility associated with using an iPhone and hence, need 3G/4G data service, and three: have not already upgraded to an iPhone 5S/5C from the gray market. If analysts took these factors into account, my guess is that the range of their estimates would be much narrower.
This story was reposted with permission from tech-thoughts.
 Sameer Singh is an M&A professional and business strategy consultant focusing on the mobile technology sector. He is founder and editor of tech-thoughts.net.
 -

Executing a 'devices & services' strategy
Publié: décembre 16, 2013, 7:13pm CET par Sameer Singh
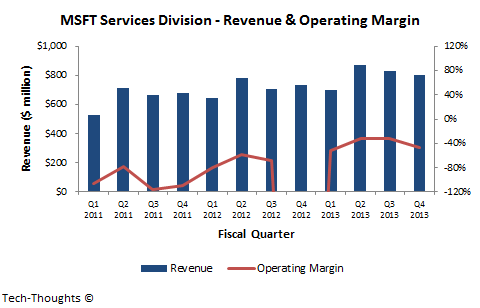
Today, Microsoft finds itself in a curious predicament -- the Company is in search of a new CEO even as it remains in the midst of an company-wide reorganization towards a "devices & services" strategy.
While I will refrain from speculating on the identity of this mystery CEO, it would seem that his job will be to effectively execute this strategy, instead of undertaking a strategic review. This may seem like a handicap, but is there more than just one way to execute this strategy.
The Steve Ballmer View
Here's Steve Ballmer's view of the proposed "devices & services" strategy:
Well, certainly we shouldn't look at hardware as a source of write-off, so let's not use the last order as a proxy for performance.
I think the right way to think about this is -- or the way we think about it is kind of an integrated business model. There's the device, the operating system, the back-end consumer services, and the extensibility of those -- of that offering into enterprise services. And across that entire range, from hardware to, quote, operating system, because in the PC world we participate through our operating system royalty as opposed to through the direct hardware economics like we participate with Xbox. You know, when we bought Skype we were quite clear that a lot of the economic value from Skype would be from Skype and Lync connection and the ability to move people between the consumer and enterprise world and monetize in the enterprise.
So I don't think you could draw a line and say we think about the economics as A or B. And certainly the guys we compete with all have different models. Apple is trying to make a lot of money on the device. Amazon is trying to make it all on the back-end. So is Google. Rather than say the model is FOO or BAR, the model is to deliver these incredible, high value experiences that will span hardware innovation, operating system, consumer experiences and enterprise experiences, and then properly monetize them, because we are a company -- unlike some of the guys in this industry, we do make a lot of money, and we want to continue to deliver a lot of good results for our shareholders. And that's not an easy way, it's nice to be able to just bucketize things, but I think that's the smart, competitive, proper way to think about it.
Essentially, Steve Ballmer's opinion is that a "devices & services" strategy would mean that Microsoft would create and profit from their own devices & services. This is also the most simplistic view of this strategy and the one least likely to succeed.
The way to understand this is to view an organization as a set of resources, processes & priorities. Resources refer to human capital, infrastructure, cash, etc. while processes & priorities refer to methods in which decisions are made in an organization. Processes & priorities tend to be difficult to change as they are built over time based on the business model that helped the organization succeed. Therefore, executing a business model shift is extremely challenging. We need to keep this in mind for the following paragraph.
The best way to profit from a services strategy is to reach the widest possible audience (Google's strategy) and the best way to profit from a devices strategy is to use exclusive services to retain the loyalty of your customer base (Apple's strategy). Therefore, the processes & priorities specific to each business model are unique. A simplistic "devices & services" model ensures that newly established processes & priorities, even if they replace previous ones, remain in continual conflict. Also, this "integrated business model" exposes the company to asymmetric competitors in both device & service markets.
An Asymmetric "Devices & Services" Strategy
As I explained above, there are two possibilities to craft an asymmetric "devices & services" strategy. One way is for Microsoft to use its devices as a cost center to help monetize services -- This strategy would only work for services like Bing, Skype, etc., as premium offerings like Office are unlikely to appeal to mass market customers. The challenge here is twofold -- 1) To create a viable ecosystem to attract customers and, 2) To ensure that Microsoft's processes & priorities are effectively transitioned to this new business model. Rumors of the forked Android Nokia handset, and a possible purchase of a third party appstore, could go some way in accelerating the process of creating a basic ecosystem (an easy way to enter a large market like China). However, it is extremely difficult for any organization to change established processes & priorities even though it is required for any business model shift.
The second way is for Microsoft to use its premium services as a moat to attract and retain customers to monetize hardware. In this case, Microsoft's services business (including Office) need to transition from a profit center to a cost center. In addition to what I highlighted above, this strategy carries even more risks. First, the entry barrier to create a viable ecosystem is even higher for premium customers (a "forked Android variant" would certainly not be enough). Second, Microsoft faces competition from cheaper, "good enough" products that also have access to a superior ecosystem.
Essentially, there is no easy way for Microsoft to transition to a "devices & services" business model. But there are a few paths that could either give them a fighting chance or seal their fate.
This story was reposted with permission from tech-thoughts
 Sameer Singh is an M&A professional and business strategy consultant focusing on the mobile technology sector. He is founder and editor of tech-thoughts.net.
 -

The state of BlackBerry and Nokiasoft
Publié: novembre 8, 2013, 11:11am CET par Sameer Singh
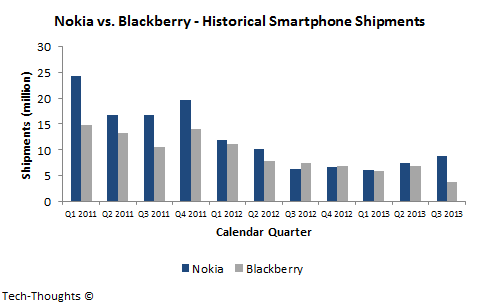
Over the past week, both BlackBerry and Nokia were in the news for very different reasons. BlackBerry abruptly abandoned its auction process and opted to raise $1 billion in debt to attempt a turnaround. Meanwhile, as the Microsoft deal awaits closing, Nokia announced that Lumia shipments hit an all-time high in the most recent quarter.
Let's take a deeper look at the prospects of each company.
Blackberry: Hoping for a Turnaround
As I expected, Fairfax was unable to raise the funds required to take BlackBerry private. But instead of opting for a break-up sale (probably the best move for shareholders), the company chose to raise $1 billion in debt from Fairfax. Prem Watsa also returned to BlackBerry's board and appointed John Chen as the interim CEO.
The company does not seem to have a firm turnaround strategy in place just yet, but John Chen's comments suggest that the company may refocus on monetizing enterprise services and messaging. This move would have been ideal if it was implemented 12-18 months ago, when hardware profits were more than sufficient to fund a transition. At this point, the hardware business is likely to continue bleeding cash and shuttering it would cost upwards of $1 billion. The problem is that BlackBerry's cost base was designed for much higher cash inflows than what the BBM and mobile device management businesses can realistically pull in, at least over the next 1-2 years.
With these factors in mind, I still believe that an eventual break-up sale is the most likely scenario for BlackBerry. While this is bad news for investors, the strategy at least reiterated some valuable lessons about declining companies.
Nokia: Beauty is Only Skin Deep
Nokia's Q3 results showed that Lumia shipments reached 8.8 million units, their highest level ever. This growth was driven by increasing sales in Europe and some surprising traction in North America. The chart below explains Lumia shipment growth:
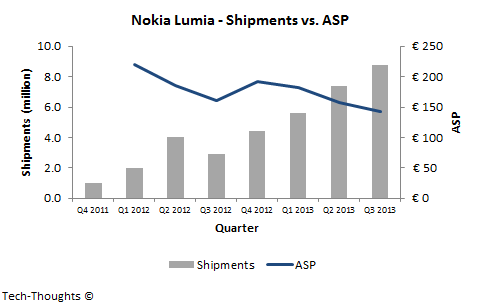
The Lumia range has grown because of increasing sales of cheaper devices (notably the Lumia 520). While this formula has worked for numerous Asian companies (Xiaomi, Lenovo, etc.), Nokia's growth isn't quite comparable because of the chart below:
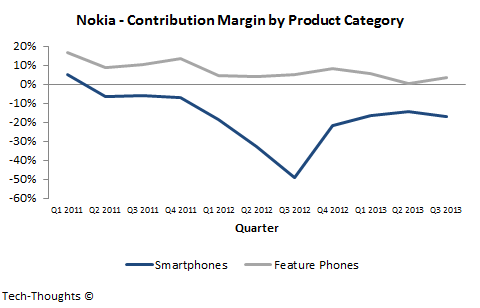
While Xiaomi and Lenovo focus selling on cheaper devices, they do so profitably. In contrast, Nokia's smartphone contribution margin has remained deeply in the red ever since the Lumia portfolio was launched and actually declined in Q3. And these figures don't even account for the loss of the Nokia brand yet. It may be time for Microsoft to rework its break-even estimates.
This story was reposted with permission from tech-thoughts
 Sameer Singh is an M&A professional and business strategy consultant focusing on the mobile technology sector. He is founder and editor of tech-thoughts.net.
 -

Tablet market share Trends -- Q3 2013: branded Android vs. IPad
Publié: novembre 5, 2013, 1:21am CET par Sameer Singh
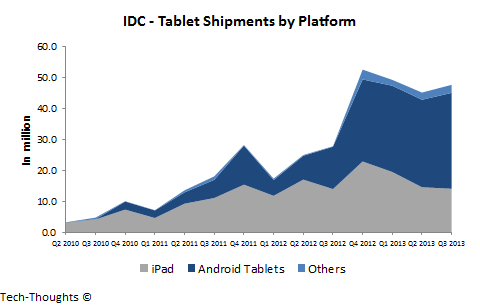
IDC recently announced their tablet shipment estimates for Q3 2013 that showed a 6 percent growth over the previous quarter. This growth was entirely driven by large, branded Android tablet vendors as iPad demand declined ahead of the product refresh. This left the Android platform with a 65 percent share of the overall market. Let's take a deeper look at these figures in context of tablet market tiers.
As I had explained previously, the tablet market can broadly be categorized into multiple tiers, based on usage patterns. Here's a look at IDC's data in context of market tiers:
In the chart above, tier 1 Android tablet vendors include Samsung, Asus, Lenovo and Acer, while all other Android vendors (incl. Amazon, white-box vendors, etc.) are listed under tier two and three. Based on this categorization, shipments from tier 1 Android vendors overtook the iPad in Q3 by gradually poaching price sensitive iPad customers (or potential iPad customers). These upmarket moves, combined with Apple's pricing decisions, led to a greater than expected decline in iPad shipments.
While iPad sales are likely to grow in the holiday quarter (first weekend sales should certainly be strong), the scale of that growth may be in question. In addition to this, tier 1 & tier 2 Android tablets are likely to see strong growth as well. Based on this, Q4 may well turn out to be a make or break quarter for the iPad.
This story was reposted with permission from tech-thoughts
 Sameer Singh is an M&A professional and business strategy consultant focusing on the mobile technology sector. He is founder and editor of tech-thoughts.net.
 -

Tablet market share Trends -- Q3 2013: branded Android vs iPad
Publié: novembre 5, 2013, 1:21am CET par Sameer Singh

IDC recently announced its tablet shipment estimates for Q3 2013 that showed a 6 percent growth over the previous quarter. This growth was entirely driven by large, branded Android tablet vendors as iPad demand declined ahead of the product refresh. This left the Android platform with a 65 percent share of the overall market. Let's take a deeper look at these figures in context of tablet market tiers.
As I had explained previously, the tablet market can broadly be categorized into multiple tiers, based on usage patterns. Here's a look at IDC's data in context of market tiers:

In the chart above, tier 1 Android tablet vendors include Samsung, Asus, Lenovo and Acer, while all other Android vendors (incl. Amazon, white-box vendors, etc.) are listed under tier two and three. Based on this categorization, shipments from tier 1 Android vendors overtook the iPad in Q3 by gradually poaching price sensitive iPad customers (or potential iPad customers). These upmarket moves, combined with Apple's pricing decisions, led to a greater than expected decline in iPad shipments.
While iPad sales are likely to grow in the holiday quarter (first weekend sales should certainly be strong), the scale of that growth may be in question. In addition to this, tier 1 & tier 2 Android tablets are likely to see strong growth as well. Based on this, Q4 may well turn out to be a make or break quarter for the iPad.
This story was reposted with permission from tech-thoughts
 Sameer Singh is an M&A professional and business strategy consultant focusing on the mobile technology sector. He is founder and editor of tech-thoughts.net.
 -

iPad mini pricing invalidates 'price umbrella' theory
Publié: octobre 24, 2013, 11:51am CEST par Sameer Singh
 Apple's long-awaited iPad refresh is finally a reality. Apple's new full-size iPad, rebranded as the "iPad Air", starts at the usual $499 price. Apple also unveiled an iPad mini with retina display, with a higher starting price of $399 and retained the original iPad mini at $299. Finally, the aging iPad 2 was also retained with the price unchanged at $399. This essentially proves my theory that Apple's pricing strategy has nothing to do with a "price umbrella" and everything to do with margins.
Apple's primary business model is selling high-margin hardware, so this should come as no surprise. While many like to draw comparisons to the iPod, the limited set of "jobs to be done" allowed Apple to aggressively slash BOM costs, thereby allowing lower prices at higher margins. This approach is no longer viable for the iPhone/iPad because of broader use cases and competition from modular vendors. Based on this, let's take a look at the iPad product portfolio and gauge its impact on Apple's holiday quarter.
9.7" iPads: iPad Air ($499) and iPad 2 ($399)
When the iPhone 5s was launched, I was critical about the need for a 64-bit processor as the product had no more room to move upmarket. However, a 64-bit processor for the iPad opens up the possibility of creating desktop class applications for enterprise users. This could help the iPad move upmarket and displace PCs for lightweight productivity. I still feel like Apple missed an opportunity here as a keyboard cover could have driven home the point. While the 64-bit architecture should open up the possibility for an upmarket move to enterprises, it is unlikely to have an immediate impact in the holiday quarter as application support needs to be expanded beyond iWork/iLife.
Apple also retained the 30-month old iPad 2 at the 18-month old $399 price. While a full-size iPad at that price price point may appeal to some niches like the education sector, the product/price trade-off looks like a clear attempt to shore up margins. If margins weren't a concern, Apple could have retained the 4th generation iPad at $399.
iPad mini: iPad mini Retina ($399) and iPad mini ($299)
This is the strategy that effectively disproves the "price umbrella" theory. If Apple's motive was to eliminate the price umbrella for competitors, it could have lowered the price of the original iPad mini to $249 or lower. Instead, Apple chose to reduce price by $30 which could be lower than the BOM reduction from last year's launch. It is clear that Apple was spooked by the cannibalization and margin erosion caused by last year's iPad mini launch and sought to correct that "mistake".
Apple also launched the highly anticipated retina iPad mini for $399. The retina display would have added to the BOM costs, so Apple chose to increase price to safeguard its margins.
Holiday Quarter Sales & Competitive Impact
After the iPad mini launch last year, consumer interest rapidly shifted from the 9.7" model to the 7.9" model. Since use cases were similar, a lower priced product seemed like the natural choice for iPad buyers. While Apple hoped to attract new buyers at the lower price, cannibalization and the lack of a mid-year iPad refresh led to a YoY decline in fiscal Q3 (and possibly another YoY decline in fiscal Q4).
Investors have pinned their hopes on this iPad refresh to revitalize demand and reignite growth. However, this refresh may not have a major impact on holiday quarter sales. The most awaited product from this refresh, the retina iPad mini, is rumored to be in short supply until early next year and seems overpriced compared to market expectations. This leaves the $499 iPad Air, the $399 iPad 2 and $299 iPad mini. Based on this and the intensity of competition from cheaper, "good enough" Android products, I wouldn't be surprised if holiday quarter iPad sales remained roughly flat. Given the growth seen by the rest of the tablet industry, this should be concerning.
-

Fairfax's BlackBerry bid: questions still remain
Publié: septembre 27, 2013, 11:49am CEST par Sameer Singh
Earlier this week, the Prem Watsa-led Fairfax group announced that it was making a $4.7 billion bid to take BlackBerry private. This followed BlackBerry's pre-announcement of disastrous Q2 results that showed smartphone shipments crashing to 3.7 million units and total revenue collapsing to $1.6 billion.
The company also took an inventory charge of roughly $1 billion because of unsold BlackBerry 10 devices. However, since the funding for the deal has not yet been secured, it may also have been a pre-announcement to halt the company's stock decline.
BlackBerry's Disastrous Q2
The company announced that 50 percent of its $1.6 billion revenue was from the services segment (roughly flat QoQ). If we assume flat revenue from the software/other segment, it leaves us with just $720 million in hardware revenue. This implies that BlackBerry's ASP fell by 38 percent sequentially to just $195. This ASP crash, combined with the large inventory write-off suggests that demand for BB10 devices is virtually non-existent. In the face of these challenges, the company announced that it was cutting 4500 jobs (40 percent of the company's workforce) and is targeting a 50 percent reduction in operating expenditures.
To Asian hardware vendors, BlackBerry's primary attraction as an acquisition target was the quality of its relationships with carriers and enterprises. These results have shown that those relationships no longer carry the same value. In addition to this, shutting down hardware unit after an acquisition is likely to cost billions more. Therefore, BlackBerry's hardware unit was considered worthless.
Fairfax's Motivations
This brings in Fairfax's $4.7 billion offer (roughly ~$2 billion excluding cash). Watsa is one of BlackBerry's largest shareholders and it may have been his goal to halt the stock decline and either take the company private or generate interest from competing bidders. However, given BlackBerry's position, the likelihood of deal financing or competing aren't incredibly high. BlackBerry investors may not be out of the woods just yet.
Reprinted with permission from Tech-Thoughts
 Sameer Singh is an M&A professional and business strategy consultant focusing on the mobile technology sector. He is founder and editor of Tech-Thoughts.
 -

Microsoft-Nokia Deal: a tale of desperation
Publié: septembre 5, 2013, 11:42am CEST par Sameer Singh

After Microsoft announced that it was acquiring substantially all of Nokia's devices & services business, the stock market painted a fairly accurate picture of what this deal means -- Nokia investors were relieved as the stock surged by nearly 35 percent, while Microsoft investors responded by driving the stock down by 5 percent. Based on my prior experience in technology M&A (Mergers and Acquisitions), I wanted to take a look at the motivations for the transaction and the viability of Microsoft's long-term consumer strategy.
Let's begin by taking a look at the deal terms. Microsoft will be paying Nokia €3.79 billion for its handset division (including 8,500 design patents) and another €1.65 billion in patent licensing. As a part of the deal, Microsoft will gain rights to the Lumia and Asha brands, but Nokia will retain the rights to the "Nokia" brand. However, Microsoft has licensed the "Nokia" brand, exclusively for use on low-end S30/40 feature phones.
Financial Perspective: Sell or Die Out
 Nokia's "Devices & Services" division generated revenues of almost €27 billion over the last 12 months. However, this included Nokia's feature phone division which is practically worthless from Microsoft's perspective. At best, Microsoft may have considered the Asha range to be relevant, while ignoring the rest of the feature phone portfolio. Using Lumia revenues for the last 12 months, the deal was valued at 1.09 times revenue (effectively €187 for every Lumia sold in the past 12 months). If we use Lumia/Asha revenue, the deal was valued at 0.71 times revenue. Earnings multiples in this case were irrelevant as Nokia was making operating losses.
This seems like a very low valuation (about half of Xiaomi's), and yet Nokia investors seemed relieved. This is because Nokia could not have a received a comparable valuation from other potential buyers. Any other company would have had to take into account the financial impact of ending the Microsoft deal and moving to an alternate operating system.
But couldn't Nokia have held out for a higher valuation? Microsoft announced that it was providing Nokia with €1.5 billion in "unconditional" financing, which means that Nokia was in significant financial distress. If it couldn't reach a deal with Microsoft, it would have to sell to another company at a far lower valuation or consider bankruptcy. With this deal, Nokia's financial position seems secure.
Strategic Perspective: Microsoft's Desperation
Ever since Stephen Elop decided to tie Nokia's smartphone future to the Windows Phone OS, the company has been Microsoft's biggest and only relevant smartphone partner. However, over the last few quarters, it was becoming clear that the partnership had failed to deliver the financial results necessary to keep Nokia going. Any other move by Nokia would have essentially killed Windows Phone. Therefore, I have to conclude that this deal was born out of desperation, not just for Nokia, but for Microsoft as well.
But why did Microsoft need to acquire Nokia's feature phone business? My guess is that Nokia's board insisted on selling the smartphone and feature phone units together. In any other case, it would have been practically impossible for Nokia to find a buyer for a standalone, loss-making and rapidly shrinking feature phone business.
What Does Microsoft Plans To Do With Nokia?
Microsoft stated that it expected $600 million in cost synergies from the deal, which will probably come from scaling down Nokia's feature phone division. Interestingly, it also stated that the Asha brand would serve as the "on-ramp" for Windows Phone, i.e., corporate-speak for "we still don't have a low-end smartphone strategy". Based on this, I would have to think that Microsoft has seriously underestimated just how significant Nokia's remnant brand value was in driving smartphone sales, especially at lower price points. If Nokia, using its own brand, was unsuccessful in transitioning its feature phone customers to smartphone buyers, how would Microsoft accomplish this feat without a coherent brand?
In a presentation outlining its rationale for the transaction, Microsoft stated annual Lumia sales needed to cross 50 million units to reach operating profitability. The problem is that this calculation assumes flat operating expenses. The contribution margin on Nokia's Smart Devices unit has been stubbornly negative, with gains coming exclusively from cost cuts.
Therefore, in order to increase Lumia volumes, Microsoft would need to cut prices and boost promotional expenses, pushing contribution margin deeper into the red. This leaves Microsoft without a financially viable hardware strategy. While Microsoft could continue throwing money at the problem, it doesn't make sense to continue to do so unless it has an alternative business model in place.
Microsoft's Devices and Services Business Model
The rapid destruction of Microsoft's PC-focused software business has forced the company to pivot to a "devices and services" strategy. The problem is, Microsoft still has not figured out a way to monetize services in the consumer segment -- its online services division still makes annual operating losses in excess of $1 billion. The entertainment business (Xbox) is modestly profitable, but a transition to mobile will not be easy. This essentially leaves hardware, which is rapidly being commoditized by modular competition, in addition to the Nokia-specific problems I highlighted above. Hardware margins are already being pressured and the situation is likely to be far worse by the time Microsoft completes its reorganization. Even if the reorganization is successful, it seems as though Microsoft is transforming itself into a vertically integrated hardware player at the worst possible moment.
With all these problems and facing the challenge of integrating Nokia into its "expanded devices and services unit" in the midst of a company-wide reorganization, I really don't see how this deal can be successful. Microsoft's track record with acquisitions certainly isn't an encouraging sign.
Reprinted with permission from Tech-Thoughts
 Sameer Singh is an M&A professional and business strategy consultant focusing on the mobile technology sector. He is founder and editor of Tech-Thoughts.
 -

History repeats, as Android does to iPad what it did to iPhone
Publié: mai 3, 2013, 8:01pm CEST par Sameer Singh
This week IDC released tablet market estimates and the figures are quite a bit off from my original Q1 estimate, but eerily similar to my revised estimate based on NPD's figures. Android tablets are poised to permanently steal the tablet market crown from the iPad, while Windows tablets continue to struggle. Let's take a deeper look at the figures.
Android now leads the tablet market, with a share of 56.5 percent, while the iPad's share falls below 40 percent. Windows tablets are still struggling, with a share below 4 percent and with struggling shipment figures, sell-through is always questionable.
As the first chart below shows, Android tablets made convincing gains over iPad in the last couple of quarters. This growth is really impressive considering the fact that it occurred in the midst of Apple's hyped iPad Mini launch. This leadership shift is not unlike the one we saw in the smartphone market, which occurred around the timeframe of Apple's iPhone 4 launch.
Apart from the leadership change, the most important takeaway from the chart is that Android tablets did not see a sequential decline in Q1. I had earlier stated that seasonality in tablet demand (especially for Android tablets) would reduce as emerging-market demand grows.
Based on the figures, I would say that demand for tablets in emerging markets has seen an explosion. This is very good news for low-cost tablet vendors, but not necessarily good news for Apple, Microsoft and the PC industry.
As I had previously showed, the growth of Android tablets in Q4 2012 was far more broad-based than in Q4 2011. Among leading Android OEMs, Samsung sees strong sequential gains, Asus maintains its position and Amazon's tablet shipments take a sharp seasonal fall (sharper than I expected).
But the big story here is the performance of "Other Android Tablets". These mid-range to low-end tablet vendors are mostly regional players, but will make more of a mark as we move forward. The Android platform enables these vendors to come out with products "good enough" for the masses at very low price points.
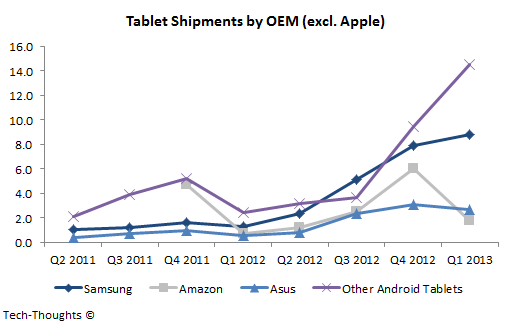
This will be a major factor in slowing shipments of PCs and Windows 8/RT tablets over the next few years.
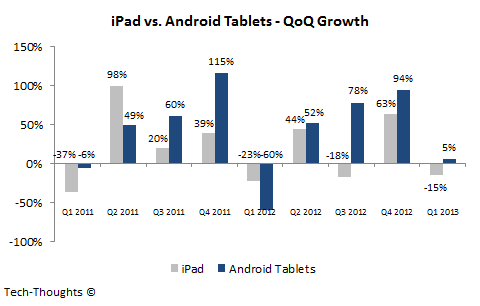
Looking at the chart above, iPad shipments normally see strong growth in calendar Q2. However, this is always driven by a new product launch. CEO Tim Cook's comments during Apple's earnings call suggest that any new products will only launch in the fall, making Q4 the first full quarter after a new iPad/iPad Mini launch. This means that iPad shipments should see another sequential decline in Q2 (to ~17-18 million).
This dynamic, combined with exploding emerging-market demand for Android tablets, is likely to push Android's market share above 60 percent (with shipments above 30 million). This would essentially be a repeat of the iPhone vs. Android battle we saw in the smartphone market, over the past couple of years.
Reprinted with permission from Tech-Thoughts
 Sameer Singh is an M&A professional and business strategy consultant focusing on the mobile technology sector. He is founder and editor of Tech-Thoughts.
 -

Apple can't escape market realities
Publié: février 1, 2013, 4:30am CET par Sameer Singh
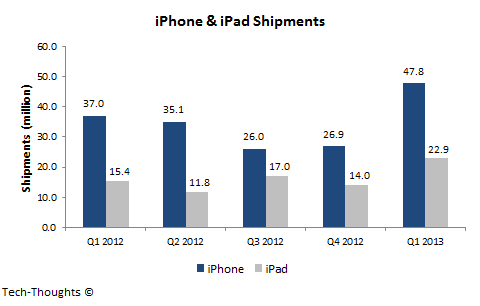
Apple's stock price tanked more than 12 percent the day after announcing fiscal 2013 first quarter earnings. Nine days later, shares are still down about 10 percent, in part because Q2 guidance came in below analyst consensus. The guidance, in particular, seems to have spooked investors as Apple announced its intentions to provide a realistic guidance, as compared to the usual "sandbagging". The company also warned of lower margins -- between 37.5 percent and 38.5 percent. In that context, let's look at the average selling price movement chart and benchmark our previous iPad Mini cannibalization estimate.
The shipment chart above clearly shows that iPhone growth has slowed during the current product cycle, thanks to market saturation. This should give Apple even more incentive to launch a cheaper iPhone. In contrast, the iPad has seen reasonably strong growth, but as I predicted, iPad Mini cannibalization seems to have pushed Q1 shipments below market expectations.
The iPhone's ASP has remained remarkably stable in Q1, given Apple's move to exclude accessory revenue (~$10-$15 per device) from product categories. On the other hand, the iPad's ASP took a nosedive because of the iPad Mini, especially compared to my ASP estimate of around $500 - the removal of accessory revenue doesn't explain this fall, but it is directly related to cannibalization:
Benchmarking iPad Mini Cannibalization
My iPad sales estimate ranged from 24.5-26.2 million units, with iPad Mini cannibalization in the 50-percent to 70-percent range. At this point, I'm virtually certain that the higher end of my iPad Mini cannibalization estimate was accurate, but I seem to have missed something. In light of the limited iPad Mini supply, I had applied my cannibalization estimate on just iPad Mini sales and not iPad Mini demand, i.e. I inherently assumed that the iPad brand would cause the potential "cannibalized" iPad Mini buyer, to buy an iPad 2/iPad 4 in case of short supply. In hindsight, that seems to have been a silly assumption.
It looks like those particular iPad Mini buyers either delayed their purchase or purchased a competing product (most likely a comparable & cheaper android tablet). Given my previous analysis, this is the only explanation I can think of for iPad sales coming in at 22.9 million.
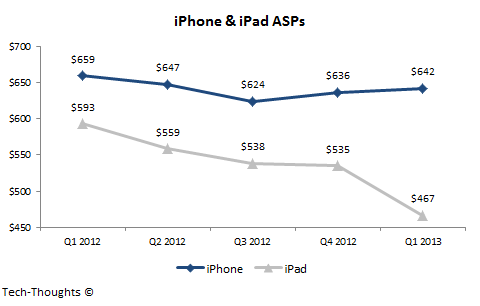
Market share figures for this quarter and iPad shipments over the next quarter should shed more light on purchasing decisions. If a majority of potential iPad Mini buyers delayed their purchases, we should expect the iPad to hold a 50-percent to 55-percent market share and iPad sales should remain strong or post a modest decline in Apple's fiscal Q2. Today, IDC released tablet shipment estimates for calendar fourth quarter. Apple share fell to 43.6 percent, indicating a good many buyers chose not to wait for iPad mini. Combined share for ASUS and Samsung, which grew by several hundred present rose from 7.9 percent to 20.9 percent.
Reprinted with permission from Tech-Thoughts
 Sameer Singh is an M&A professional and business strategy consultant focusing on the mobile technology sector. He is founder and editor of Tech-Thoughts.
 -

It's not IF but WHEN Verizon and AT&T follow T-Mobile's subsidy-free plans
Publié: janvier 14, 2013, 5:54pm CET par Sameer Singh

Verizon and AT&T are closely watching how consumers respond to T-Mobile's move to end smartphone subsidies. However, a look at their comments gives me the impression that they haven't had a detailed look at T-Mobile's value plans.
In recent comments, CEOs of both companies stated that they were ready to follow T-Mobile and offer non-subsidized plans if they prove popular with consumers. However, both CEOs caution that consumers don't "like paying upfront for the phone" and are used to getting "low-cost phones". Based on these comments, I'd have to believe they were misquoted in some way because I find it hard to believe that the CEOs of the two biggest carriers in the United States could be so misinformed.
T-Mobile's value plans don't subsidize devices, but finance them. This way consumers pay for devices in monthly installments so that the upfront cost remains comparable to subsidized plans and device costs become transparent. More importantly, the data plans themselves have lower margins and therefore, the monthly amount a consumer pays also remains comparable to subsidized plans until the device is fully paid for. Once the device is paid for, a value plan becomes far cheaper than a comparable subsidized plan. This gives consumers an incentive to hold on to his device for a longer time period, thereby extending the handset replacement cycle, as I showed earlier.
Let's use this illustration by Jared Newman to demonstrate. If a consumer were to buy a Galaxy Note 2, on a two-year contract (on comparable data plans), from AT&T and T-Mobile (on a value plan), he would incur the following costs:
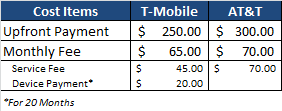
In this case, if the consumer were to opt for an unsubsidized value plan over AT&T's subsidized plan, he would save $50 on upfront costs and save $5 every month. If the consumer opts to keep the same device while renewing the contract, his monthly expenses come down by $25.
From the carrier's perspective, the plan is financially neutral for the duration of the contract (as the reduction in subsidies matches the reduction in monthly revenue). After the contract expires, the consumer has a considerable financial incentive to hold on to his device, as it reduces his monthly cost, while putting no financial burden on the carrier. By comparison, smartphone upgrades offered to consumers, under subsidized plans, put a huge subsidy burden on the carrier. In addition, unsubsidized plans also vastly bring down the cost of acquiring smartphone subscribers, i.e. costs associated with churn rate.
At the end of the day, I still believe the most crucial factor will be the impact of T-Mobile's value plans on their competitors' churn rates. If churn rates at Verizon and AT&T increase (based on the illustration above, that seems to be a certainty), then they will make immediate moves to incorporate unsubsidized value plans into their offerings and complete the transition by the time their contracts (stipulating subsidy terms) with Apple run out. If that happens, OEMs (especially Apple) should see a fairly sharp decline in smartphone sales and average selling prices in the U.S. market.
Reprinted with permission from Tech-Thoughts
 Sameer Singh is an M&A professional and business strategy consultant focusing on the mobile technology sector. He is founder and editor of Tech-Thoughts.
 -

Nexus 7 will lead Android tablets to overtake iPad
Publié: juillet 24, 2012, 4:35pm CEST par Sameer Singh
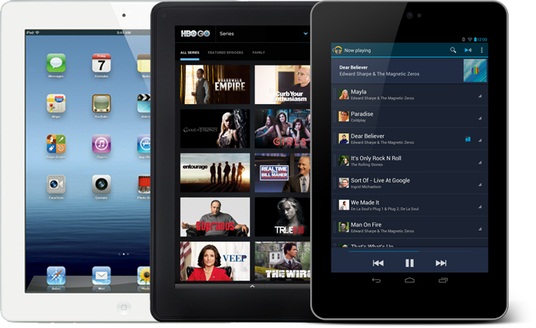
Ever since the release of the Nexus 7, analysts have wondered what impact, if any, it would have on Android tablets' market share battle with the iPad. The possible release of the iPad Mini, later this year, could throw another wrench into the works. Fortunately, we have already seen an Android vs. Apple battle in the smartphone market. Let's take a look at the parallels we can draw between the smartphone and tablet market and project the possible market share trends in the tablet market.
Before we begin, we need to understand the global smartphone market share trends over the past couple of years. It is important to understand that ever since the iPhone and Android were launched, the market segmented into legacy smartphone platforms (BlackBerry, Symbian & Windows Mobile) and modern smartphone platforms (iOS, Android & Windows Phone).
Modern Mobile Platforms
We can say this with a certain degree of confidence, as consumers upgrading their smartphones would almost always move from a "legacy" platform to a "modern" one. Platform shifts, after this change, were almost always within "modern" platforms. Since we have seen that Windows Phone has had practically no impact on the smartphone market, the battle of modern smartphone platforms devolved into the Android vs. iPhone battle we see today.
Having understood this, we see that "modern" smartphone platforms are essentially a separate market. So, let's take a look at the quarterly market share in just the iPhone vs. Android smartphone market, since the Android platform was launched (based on Gartner's global smartphone market share figures).
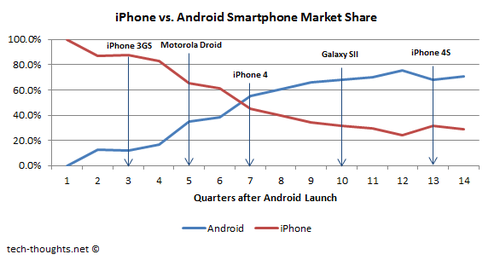
These figures show that Android's smartphone market share overtook the iPhone, 7 quarters after its release. While this pattern is important, it is even more important to understand the reasons behind this. Most analysts look at smartphones and tablets exclusively from the perspective of the US market. This is a fairly myopic view, and ignores the larger reasons for the trends prevalent in the smartphone market.
Think Globally
While the United States was a major driver of Android's smartphone market share growth in the first few quarters, the primary reason for the sharp growth of the Android platform was international markets like Europe and a dominant presence in fast growing, emerging markets like China and South-East Asia. The strength of Android smartphones in these markets was because Android devices were diversified across price points and could effectively target consumers from various income levels.
Now let's take a look at the tablet market share trends between Android and the iPad since Android tablets were launched.
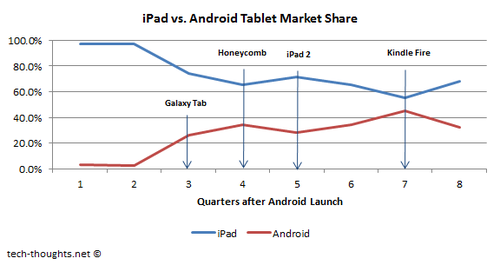
The first real Android tablet to hit the market was the Samsung Galaxy Tab (in quarter 3 on the chart) and prior to that, we had only products that could be categorized as "phablets", such as the 5-inch Dell Streak. Therefore, quarter 2 in the chart above correlates with quarter 1 in the smartphone market share chart, which represents the Android platform effectively starting from scratch. Quarter 8 in the chart above is an outlier when compared to the rest of the tablet & smartphone market share data.
This anomaly was caused because there was a huge sequential drop in tablet shipments caused by excess Kindle Fire inventory built up during the holiday season. Now, in most cases, shipment figures are an acceptable substitute for sales figures, but that ceases to be the case when there is a large sequential drop in shipments. According to the NPD Group, this anomaly was restricted to shipments and that actual sales market share in both quarters 7 & 8 was estimated to be somewhere in-between both figures.
Android Tablet Gains
Now let's compare the smartphone and tablet market share trends from the respective release dates of the Android platform against Apple and try and project the future of the tablet industry.
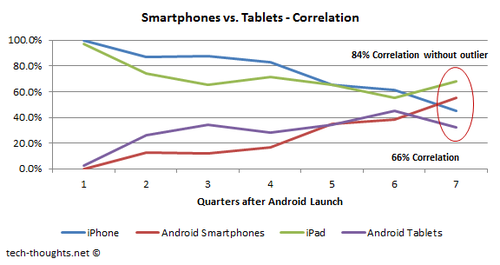
This is interesting. The comparison in the chart above shows that the much maligned Android tablets have actually grown market share, against Apple, at a much faster pace than their smartphone cousins. Also, while quarter 7 was the quarter in which Android smartphones overtook the iPhone, it was the same quarter that saw the sequential shipment anomaly in the tablet market.
Does this mean that Android tablet market share should overtake the iPad in Q2? Absolutely not, since the new iPad was released in that quarter. Apple's devices always see a market share boost around a new launch. However, the market share picture gets more interesting in Q3 with the launch of the Nexus 7, which has proved extremely popular in the market and the upcoming Kindle Fire 2. Based on the figures above, it is easy to see Android tablets overtaking the iPad's market share, with Apple's current strategy, by Q4 of this year. However, Apple's decisions over the next few months could have a major impact on this.
Apple seems to be taking the threat of price diversification more seriously this time around. Apple has been rumored to launch an iPad Mini later this year to take on competition from the Nexus 7 and Amazon's upgraded Kindle Fire. However, reports suggest that it is the Nexus 7's 16GB model that has proved far more popular in the market. Apple would have a hard time getting the price of an 8GB iPad Mini below $299, but getting a 16GB iPad Mini into the market at that price point would be extremely difficult considering the fact that Apple sells the 16GB iPad 2 at $399.
Inevitable Outcome
From a market share perspective, the best case scenario for Apple would be to launch an 8GB iPad Mini at $249 and a 16GB version at $299. This could give it enough ammunition to compete with the onslaught of low cost tablets from Android. Unfortunately, this may also pressure Apple's margins to the point where it becomes unpalatable to the stock market. The more likely outcome is the launch of an 8GB iPad Mini at $299.
Tablet shipments in emerging markets are set to skyrocket next year, says Pyramid Research, and Android tablets already have a dominant presence in these markets, according to GfK Retail and Technology Asia. Given this fact, the entry of high quality, low-priced tablets like the Nexus 7 would create a huge boom in the international tablet market over the next year and could lead to Android tablets overtaking the iPad in Q2 or Q3 of next year, even after the launch of an 8GB iPad Mini at $299.
Conclusion: Looking at the early trends in the smartphone market, it is easy to come to the conclusion that Android tablets will eventually overtake the iPad because of their strong presence in emerging markets and pricing advantage. However, the timing of this change of guard will not only hinge on Apple's launch of an iPad Mini, but the pricing strategy they choose to follow.
P.S.: This analysis ignores the potential impact of Microsoft's Surface & Windows 8 tablets because I expect them to have relatively small significance on the market, due to various reasons I have already covered. While the market impact may not be as muted as that of Windows Phone, they will have a very difficult time competing with the iPad and Android tablets, in terms of both pricing and content.
 Sameer Singh is an M&A professional and business strategy consultant focusing on the mobile technology sector. He is founder and editor of tech-thoughts.net.
 -

iPhone kills carrier profits
Publié: juin 7, 2012, 6:14pm CEST par Sameer Singh

Second in a series. Two days ago, I established that iPhone's market share is heavily dependent on carrier subsidies. Now let's take a look how iPhone subsidies affect carriers and the potential impact this could have on Apple.
To Summarize, under iPhone's current subsidy structure, it is practically impossible for carriers to break-even. Even when factoring higher churn rate of other smartphones and lower cost of retaining iPhone users, Apple's device still costs carriers too much to be really profitable compared to other smartphones. Essentially, Android, BlackBerry and Windows Phone users subsidize iPhone owners. Carriers make more money from non-iPhone smartphone owners, while raising data and early-termination fees to offset iPhone costs.
Are iPhone Subsidies a Problem for Carriers?
Apple CEO Tim Cook had the following to say, to calm investors regarding any potential fears about carrier subsidies:
The most important thing by far is for Apple to continue making great products that customers want. And we are deeply committed to doing this and are innovating at a rate and pace that's unbelievable in this area. For -- from a carrier's perspective, I think it's important to remember that the subsidy is not large relative to the sum of the monthly payments across a 24-month contract period. And any delta between iPhone and maybe another phone is a -- an even smaller level of difference.
And iPhone has some distinct advantages for the carrier over competing smartphones. For example, many of the carrier executives have told me that churn from iPhone customers is the lowest of any phone they sell in their whole -- in all of the phones they carry. And that has a significant direct financial benefit to the carrier.
Also, our engineering teams work extremely hard to be efficient with data and differently than some others. And we believe that as a result of this, that iPhone has far better data efficiency compared to other smartphones that are using sort of an app-rich ecosystem.
Finally, we think that the -- and this is the most important, is that iPhone is the best smartphone on the planet to entice a customer who is currently using a traditional mobile phone to upgrade to a smartphone. This is by far the largest opportunity for Apple, for our carrier partners and is a great, fantastic experience to the customer. And so there's a win-win-win there.
While Tim Cook is one of the best CEOs in the world right now, I would rather not take his words at face value. So let's analyze his arguments and see if they hold any water.
I've focused on the US market, as these trends would most likely hold good across the globe. Analyzing figures from AT&T and Verizon, for the last four quarters, can give us great insight into the financial impact of iPhone. Since Sprint only began selling iPhone in Q4 2011, it has been excluded from this analysis.
Incremental Subsidy Costs
The primary reason for iPhone's dependence on carrier subsidies is that all models are high-priced, high-margin products for Apple. So even though a subscriber may get an iPhone 3GS for free or an iPhone 4 for $99 on a two year contract, carriers still have to pay Apple an average subsidy of roughly $400 - $450 per device. Meanwhile, Apple's competition is diversified across price points, receiving an average of $200-$300 in subsidies per device. On average, it is safe to assume that iPhone receives an incremental subsidy of $150 per device, when compared to the competition.
Based on the incremental subsidy per device and iPhone sales from AT&T and Verizon from Q2 2011 to Q1 2012, we can calculate the total incremental subsidy burden for these two carriers.
Subscriber Churn Savings
Cook may very well be right in his assertion that iPhone subscribers have a lower churn rate than those using competing smartphones. But according to Consumer Intelligence Research Partners (CIRP), the churn rate among iPhone subscribers is just 6-percent lower than other smartphone subscribers, which means the reduction in carriers' overall smartphone churn rate would be even lower. Now we need to understand the cost savings that carriers receive thanks to iPhone and compare that with the additional subsidy burden. To calculate these cost savings, I have actually assumed that the overall smartphone churn rate of carriers reduces by 6 perceent because of carrying iPhone, which implies the churn rate reduction among iPhone users is assumed to be around 10%. This assumption actually favors Apple's stance more than Consumer Intelligence's findings do.
There are numerous estimates of the cost of acquiring a wireless subscriber. According to one estimate, the cost of acquiring a wireless subscriber ranges from $300 to $400. Another estimate measures this cost at $250 to $300 per customer. A research report from 1998 also estimates this cost as $400. Since estimates seem to be fluctuating even over such a long time frame, we can make a safe assumption of the cost of acquiring a customer as the high end of the ranges mentioned here, i.e. $400. Most reports also mention that acquiring a new customer costs five times as much as retaining a current customer, i.e. $80. So, the incremental cost to replace a subscriber would be the difference of these two, i.e. $320.
Now, using the figures above, in conjunction with the number of postpaid smartphone subscribers for Verizon (47 percent of 88 million postpaid subscribers) and AT&T (41.2 million postpaid smartphone subscribers), we can estimate the total savings carriers have gained thanks to the reduction in churn rate, due to iPhone. The actual cost savings would be lower than this as the average size of the AT&T and Verizon subscriber base over the last four quarters would be lower than the size in the latest quarter.
Churn Savings vs. Subsidy Cost
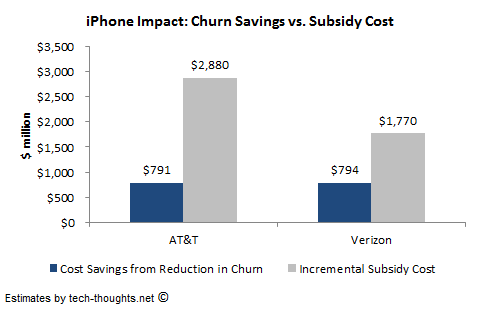
As the chart clearly shows, costs savings due to reduced churn is only 27 percent of incremental subsidy cost for AT&T and 45 percent for Verizon. This means AT&T is actually losing a net figure of more than $2 billion, while Verizon is losing nearly $1 billion, due to high iPhone subsidies. Verizon's gap is lower because it sold fewer iPhones than AT&T. This gap is so large that any realistic change in inputs would not affect the outcome by much. And the really scary part for carriers is that incremental subsidy costs would continue to outgrow cost savings as iPhone sales increase.
We can also estimate the cost savings and the corresponding reduction churn rate required to break even on iPhone's incremental subsidy costs. Using average monthly churn figures for AT&T and Verizon from Q2 2011 to Q1 2012, we can calculate the also average annual churn rate for these carriers and compare these figures with the required reduction in churn rate:
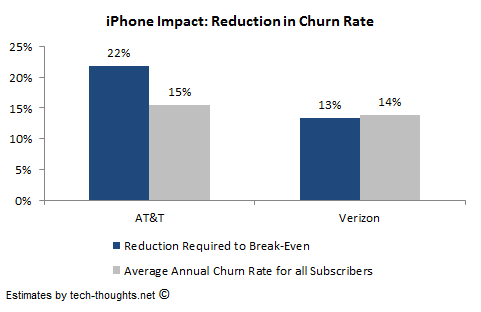
Does anybody else see a problem here? The required reduction in churn rate to break even on the subsidies is actually higher at AT&T and nearly equal at Verizon, when compared to the average annual churn rate for all subscribers (smartphones & feature phones). Given that both Verizon and AT&T have a monthly churn rate in the range of 1-1.5 percent for smartphone subscribers, the average annual churn rate for smartphone subscribers would be in the same range as in the chart above. Given these figures, it is practically impossible to achieve break-even under iPhone's current subsidy structure.
This analysis does not even take into account the fact that Android smartphones consume nearly 20 percent more data than iPhones (this seems to hold true even with iCloud and Siri). In the absence of "all-you-can-eat" data plans, which is where carriers seem to be moving, this would translate into a much higher average revenue per user (ARPU) figure from Android smartphone subscribers as compared to iPhone subscribers. Clearly, there is no incremental ARPU gained from iPhone subscribers that can even begin to balance out the incremental subsidy costs.
Based on the analysis above, it is clear that Cook's comments do not mean much from a carrier's perspective and that iPhone's current subsidy level is unsustainable. The only positive is that iPhones use less data and hence, place less load on network infrastructure, but that results in lower ARPU as well.
Can Carriers Really Reduce Subsidies on iPhone?
Carriers have already begun their efforts to reduce the impact of subsidies on their financials:
1. The push started with US carriers increasing upgrade fees for customers who wanted to switch phones and increasing data subscription charges.
2. Verizon has told its subscribers that their current unlimited data plans will only remain available for customers who buy phones at full retail price, i.e. with zero subsidies.
3. AT&T made the boldest move, by announcing its intention to limit 2011 smartphone sales to 2012 levels, and most importantly push to reduce subsidies on phones it currently sells. Given that iPhone accounted for 78 percent of AT&Ts Q1 2012 smartphone sales, that push is obviously going to be against Apple.
CLSA has argued that the presence of most favored nation (MFN) clauses in all of Apple's contracts with US carriers would mean that "US carriers would need permission from Apple to alter subsidy levels". To be honest, this argument doesn't make much sense. CLSA admits that the presence of a MFN clause implies that any offering to one carrier has to necessarily be offered to another. An MFN clause, by definition, ensures that if one carrier is able to negotiate better terms with Apple when their contract runs out, those terms are applicable to the existing contracts of the other carriers as well. The MFN clause in no way implies that you need permission to implement the clause. Therefore, with AT&T's contract set to run out first, it would also be beneficial for Verizon and Sprint if AT&T was able to negotiate lower carrier subsidies from Apple.
AT&T is very clear that it intends to reduce iPhone's subsidy burden. Since AT&T is the responsible for the highest number of iPhone sales in the country and iPhones comprise a majority of AT&T's smartphone sales, neither AT&T nor Apple would consider walking away from each other. My guess is that both sides play hardball and eventually come to a compromise, resulting in a reduction of iPhone subsidies across all US carriers to a more manageable level.
Apple's carrier subsidy reduction could either be implemented by allowing carriers to increase contract prices or by reducing margins on iPhone. Cook's decision could boil down to a classic volumes vs. margins debate.
Conclusion: From the analysis above, it is clear iPhone subsidies are not beneficial to carriers and seem to be unsustainable. Since the massive margins and volumes on iPhone are the biggest reason driving Apple's high gross margins on a consolidated basis, any reduction could negatively affect Apple's stock price.
Reprinted with permission.
Photo Credit: Lou Oates/Shutterstock
Sameer Singh is an M&A professional and business strategy consultant focusing on the mobile technology sector. He is founder and editor of tech-thoughts.net.
-

iPhone market share heavily depends on carrier subsidies
Publié: juin 5, 2012, 10:44pm CEST par Sameer Singh
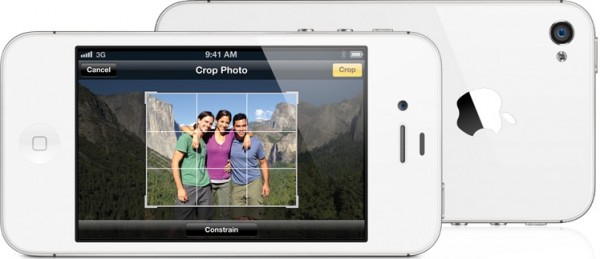
First in a series. Recently, there have been some articles stating that carrier subsidies may pose a risk to Apple. But before we accept or reject this assertion at face value, it would be prudent to find out just how much of an impact they have. We can do this by delving into a statistical analysis to isolate the key drivers of the iPhone's country-wise market share. So let's dive right in.
To start off with the analysis, we need to create a shortlist of a few key drivers that could have a major impact on the iPhone's market share. If these inputs do not have much of an impact, then the analysis would show us as much, so this initial shortlist doesn't have any bearing on the actual outcome of the analysis. My shortlist:
- Brand Strength and Product Quality (difficult to quantify)
- Purchasing Power of consumers in a given country
- Carrier Subsidies
Analysis Inputs
Even though Brand Strength could not be directly included in the analysis, the percentage of variation in the iPhone's market share that is explained by changes in purchasing power and carrier subsidies, would give us a hint of the dependence on brand/product quality or any other factors as well.
It is important to mention that we are benchmarking these drivers with the iPhone's market share, and not absolute sales volume. It is obvious that carrier subsidies and purchasing power would be directly proportional to sales volume, since higher sales volume can be achieved at lower prices, while selling to consumers who have higher disposable income. These factors would affect all smartphone manufacturers and not just Apple. So we need to understand if these drivers have a greater impact on the iPhone's sales volume and hence, its market share and understand the implications of that impact.
So, our first task is to compile a list of countries along with the iPhone's market share in that country, the average carrier subsidy given to the iPhone and a measure of purchasing power parity (PPP) of that country. I managed to get a hold of data (see chart below) for 11 countries (the limiting factor for the selection of these countries was the availability of subsidy data).
Market share. The market share figures here are for sales in the most recent quarter or year (based on availability of figures). The only case where I had to take the market share for active devices was for Canada, as I couldn't find any alternate data (I've performed a sensitivity analysis of this data point just to make sure, and the variation is insignificant).
Market Share figures for USA, UK, Australia, Germany and Spain are from Kantar Worldpanel. The US market share for the iPhone seems a little inflated to me, being far higher than what all the other research firms have reported. But it wouldn't be right to ignore just the US figures from Kantar Woldpanel, so I performed the analysis separately with both Kantar Worldpanel's US market share numbers, as well as NPD's numbers to ensure this didn't skew the analysis.
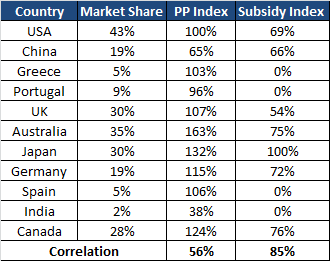 Here are the sources for market share figures of the remaining countries -- China, Japan,India, Greece and Portugal. Kantar Worldpanel did include data for a few more countries, like France and Italy, but unfortunately, for these countries I was unable to uncover any reliable data on subsidies.
PP Index. This indicates the purchasing power of the consumers in the respective country, indexed to the US. So, the US has a PP index of 100 percent, while the purchasing power of other countries is a number relative to the US. I calculated the purchasing power index by taking the ratio of the country's nominal GDP to PPP adjusted GDP, as per IMF estimates.
Subsidy Index. This was the trickiest part. According to most reports, the most popular iPhone model is the 16GB iPhone 4S, and last year, it was the 16GB iPhone 4. The subsidy index is essentially the percentage of the retail price of an iPhone that has been subsidized by carriers.
In order to calculate this, I have considered the subsidized price of the 16GB iPhone 4S on a two year contract in relation to the unsubsidized retail price. I believe this is representative of the average subsidy per iPhone because of two reasons. First, this was the same price that the 16GB iPhone 4 sold at before the iPhone 4S was launched. Second, older iPhone models, like the current 8GB iPhone 4 are being sold completely subsidized and the higher end iPhone models (32GB and 64GB) are being sold with the same absolute subsidy amount, but with a higher retail price -- this means that the subsidized percentage is smaller. Hence, the average subsidy level would fall at around the same level as the 16GB iPhone 4S. In any case, the most important part of the data is the way the subsidy pattern changes across countries, which would be the same irrespective of the iPhone model we use to index the data against.
Here are my sources for the country-wise iPhone subsidy -- USA, China (China Telecom),UK (Vodafone), Australia, Japan, Germany, Canada (Telus), Greece and Portugal. Spanish carriers have already stopped carrier subsidies and Indian carriers have so far refrained from this practice as well. For some countries, I had to consider data from individual carriers, as all carriers did not separate device cost from data usage cost.
Correlation. The correlation between iPhone market share and the subsidy index is incredibly high, at 85 percent. When we consider NPD's market share data for the US, this becomes even higher at 90 percent. Meanwhile, the correlation between iPhone market share and the PP Index is just 56 percent. But just by looking at these figures, we cannot conclude that iPhone market share is dependent on carrier subsidies. We have established correlation, but not causality.
Regression Analysis
Our goal now is to test if a causal relationship exists between iPhone market share and the Subsidy/PP Index. In order to do this, we need to perform a multiple linear regression analysis with iPhone market share as the dependent variable and the Subsidy Index and PP Index as independent variables. In order to explain the output of the regression analysis, I will have to delve into some statistical principles. So, to make this easy for readers, I've separated the output into two sections -- Statistical Interpretation and Practical Interpretation. Readers who are unfamiliar with statistical principles can just skip to the next section.
Statistical Interpretation
Here is the output of the multiple linear regression analysis (with Kantar Worldpanel's US market share figures):

On first glance, we can clearly see that R Square of the model is 0.735, which indicates that that our model is quite robust. The F Significance is just 0.5 percent, which is well within the 5 percent significance level, implying a confidence level of 99.5 percent. The Subsidy Index has a p-value of 0.7 percent, which is also well within the 5 percent significance level. However, the PP Index has a p-value of 48 percent and hence is not statistically significant.
If we use US market share figures from NPD, the R Square improves to 0.855, with an F significance of just 0.04 percent, i.e. a confidence level of 99.96 percent. The Subsidy Index has a p-value of 0.1 percent, i.e. a confidence level of 99.9 percent. Even here, the PP Index has a p-value of 15 percent and hence is not statistically significant. This shows us that while NPD's US market share numbers improve the model, they give us essentially the same results.
Now, since PP Index is not statistically significant to our model. I also ran a simple linear regression to see just how strong the impact of carrier subsidies is. Here is the output of the simple linear regression analysis (with Kantar Worldpanel's US market share figures):
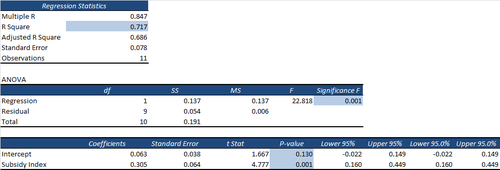
This is really the clincher. The R Square is 0.717 when we use the Subsidy Index as a single independent variable. The F Significance is just 0.1 percent and the Subsidy Index also has a p-value of just 0.1 percent.
When we use NPD's US market share figures, the R Square improves to a staggering 0.809. The F Significance is 0.2 percent and the Subsidy Index also has a value of 0.2 percent.
This again proves just how robust our model is and conclusively proves that the iPhone's market share is heavily dependent on carrier subsidies.
To ensure that this is correct, I have also measured the impact of carrier subsidies on Android's market share. I assumed the same carrier subsidy percentage for Android, as that is likely even if the absolute subsidy amount differs. In addition, the subsidy index across countries would definitely follow the same pattern. The results showed no statistical significant results as the R Square was just 0.076, with an F significance of 85 percent.
Practical Interpretation
Based on the outputs of our regression analysis, we see that the iPhone's market share is heavily dependent on carrier subsidies but, interestingly, does not depend on purchasing power in a given country. More than 70 percent of the variation in the iPhone's market share can be explained exclusively by carrier subsidies. This figure improves to more than 80 percent if we consider NPD's US market share figures, which not only proves the dependence of the iPhone's market share on carrier subsidies, but also that our model is fairly accurate. We have also been able to prove that carrier subsidies have no impact on the market share of Android smartphones.
Using the derived coefficients from the regression analysis, we can derive an estimation of the iPhone's market share in any country:
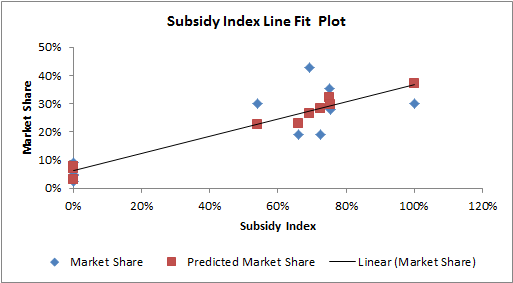
iPhone Market Share = 6.3% + 0.305 x Subsidy Index
The intercept of 6.3 percent gives us an indication of the impact of Apple's brand strength on its market share and a rough estimate of the expected market share in a world without carrier subsidies. Clearly, this is far lower than the impact carrier subsidies have on its market share.
The value of the intercept may not necessarily be accurate as it may depend on the brand loyalty for Apple in that particular country as compared to other manufacturers. But the model can accurately estimate the impact of changes in carrier subsidies on the iPhone's market share. For the US market, this translates into the iPhone losing roughly 4-5 percent in market share for every $100 reduction in carrier subsidies.
Based on the output of the regression model, it is clear that the iPhone derives most of its market share thanks to carrier subsidies and the impact of other factors like brand loyalty are comparatively low. Stay tuned for my next article on why the iPhone is so dependent on subsidies and why this will be a big problem for Apple.
Sameer Singh is an M&A professional and business strategy consultant focusing on the mobile technology sector. He is founder and editor of tech-thoughts.net.