First in a series. Recently, there have been some articles stating that carrier subsidies may pose a risk to Apple. But before we accept or reject this assertion at face value, it would be prudent to find out just how much of an impact they have. We can do this by delving into a statistical analysis to isolate the key drivers of the iPhone's country-wise market share. So let's dive right in.
To start off with the analysis, we need to create a shortlist of a few key drivers that could have a major impact on the iPhone's market share. If these inputs do not have much of an impact, then the analysis would show us as much, so this initial shortlist doesn't have any bearing on the actual outcome of the analysis. My shortlist:
- Brand Strength and Product Quality (difficult to quantify)
- Purchasing Power of consumers in a given country
- Carrier Subsidies
Analysis Inputs
Even though Brand Strength could not be directly included in the analysis, the percentage of variation in the iPhone's market share that is explained by changes in purchasing power and carrier subsidies, would give us a hint of the dependence on brand/product quality or any other factors as well.
It is important to mention that we are benchmarking these drivers with the iPhone's market share, and not absolute sales volume. It is obvious that carrier subsidies and purchasing power would be directly proportional to sales volume, since higher sales volume can be achieved at lower prices, while selling to consumers who have higher disposable income. These factors would affect all smartphone manufacturers and not just Apple. So we need to understand if these drivers have a greater impact on the iPhone's sales volume and hence, its market share and understand the implications of that impact.
So, our first task is to compile a list of countries along with the iPhone's market share in that country, the average carrier subsidy given to the iPhone and a measure of purchasing power parity (PPP) of that country. I managed to get a hold of data (see chart below) for 11 countries (the limiting factor for the selection of these countries was the availability of subsidy data).
Market share. The market share figures here are for sales in the most recent quarter or year (based on availability of figures). The only case where I had to take the market share for active devices was for Canada, as I couldn't find any alternate data (I've performed a sensitivity analysis of this data point just to make sure, and the variation is insignificant).
Market Share figures for USA, UK, Australia, Germany and Spain are from Kantar Worldpanel. The US market share for the iPhone seems a little inflated to me, being far higher than what all the other research firms have reported. But it wouldn't be right to ignore just the US figures from Kantar Woldpanel, so I performed the analysis separately with both Kantar Worldpanel's US market share numbers, as well as NPD's numbers to ensure this didn't skew the analysis.
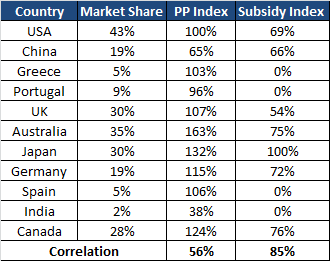 Here are the sources for market share figures of the remaining countries -- China, Japan,India, Greece and Portugal. Kantar Worldpanel did include data for a few more countries, like France and Italy, but unfortunately, for these countries I was unable to uncover any reliable data on subsidies.
PP Index. This indicates the purchasing power of the consumers in the respective country, indexed to the US. So, the US has a PP index of 100 percent, while the purchasing power of other countries is a number relative to the US. I calculated the purchasing power index by taking the ratio of the country's nominal GDP to PPP adjusted GDP, as per IMF estimates.
Subsidy Index. This was the trickiest part. According to most reports, the most popular iPhone model is the 16GB iPhone 4S, and last year, it was the 16GB iPhone 4. The subsidy index is essentially the percentage of the retail price of an iPhone that has been subsidized by carriers.
In order to calculate this, I have considered the subsidized price of the 16GB iPhone 4S on a two year contract in relation to the unsubsidized retail price. I believe this is representative of the average subsidy per iPhone because of two reasons. First, this was the same price that the 16GB iPhone 4 sold at before the iPhone 4S was launched. Second, older iPhone models, like the current 8GB iPhone 4 are being sold completely subsidized and the higher end iPhone models (32GB and 64GB) are being sold with the same absolute subsidy amount, but with a higher retail price -- this means that the subsidized percentage is smaller. Hence, the average subsidy level would fall at around the same level as the 16GB iPhone 4S. In any case, the most important part of the data is the way the subsidy pattern changes across countries, which would be the same irrespective of the iPhone model we use to index the data against.
Here are my sources for the country-wise iPhone subsidy -- USA, China (China Telecom),UK (Vodafone), Australia, Japan, Germany, Canada (Telus), Greece and Portugal. Spanish carriers have already stopped carrier subsidies and Indian carriers have so far refrained from this practice as well. For some countries, I had to consider data from individual carriers, as all carriers did not separate device cost from data usage cost.
Correlation. The correlation between iPhone market share and the subsidy index is incredibly high, at 85 percent. When we consider NPD's market share data for the US, this becomes even higher at 90 percent. Meanwhile, the correlation between iPhone market share and the PP Index is just 56 percent. But just by looking at these figures, we cannot conclude that iPhone market share is dependent on carrier subsidies. We have established correlation, but not causality.
Regression Analysis
Our goal now is to test if a causal relationship exists between iPhone market share and the Subsidy/PP Index. In order to do this, we need to perform a multiple linear regression analysis with iPhone market share as the dependent variable and the Subsidy Index and PP Index as independent variables. In order to explain the output of the regression analysis, I will have to delve into some statistical principles. So, to make this easy for readers, I've separated the output into two sections -- Statistical Interpretation and Practical Interpretation. Readers who are unfamiliar with statistical principles can just skip to the next section.
Statistical Interpretation
Here is the output of the multiple linear regression analysis (with Kantar Worldpanel's US market share figures):
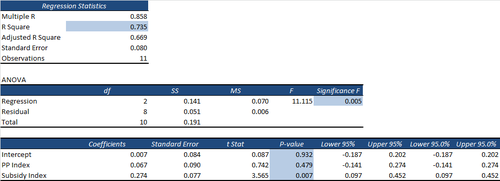
On first glance, we can clearly see that R Square of the model is 0.735, which indicates that that our model is quite robust. The F Significance is just 0.5 percent, which is well within the 5 percent significance level, implying a confidence level of 99.5 percent. The Subsidy Index has a p-value of 0.7 percent, which is also well within the 5 percent significance level. However, the PP Index has a p-value of 48 percent and hence is not statistically significant.
If we use US market share figures from NPD, the R Square improves to 0.855, with an F significance of just 0.04 percent, i.e. a confidence level of 99.96 percent. The Subsidy Index has a p-value of 0.1 percent, i.e. a confidence level of 99.9 percent. Even here, the PP Index has a p-value of 15 percent and hence is not statistically significant. This shows us that while NPD's US market share numbers improve the model, they give us essentially the same results.
Now, since PP Index is not statistically significant to our model. I also ran a simple linear regression to see just how strong the impact of carrier subsidies is. Here is the output of the simple linear regression analysis (with Kantar Worldpanel's US market share figures):
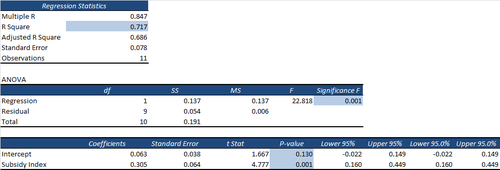
This is really the clincher. The R Square is 0.717 when we use the Subsidy Index as a single independent variable. The F Significance is just 0.1 percent and the Subsidy Index also has a p-value of just 0.1 percent.
When we use NPD's US market share figures, the R Square improves to a staggering 0.809. The F Significance is 0.2 percent and the Subsidy Index also has a value of 0.2 percent.
This again proves just how robust our model is and conclusively proves that the iPhone's market share is heavily dependent on carrier subsidies.
To ensure that this is correct, I have also measured the impact of carrier subsidies on Android's market share. I assumed the same carrier subsidy percentage for Android, as that is likely even if the absolute subsidy amount differs. In addition, the subsidy index across countries would definitely follow the same pattern. The results showed no statistical significant results as the R Square was just 0.076, with an F significance of 85 percent.
Practical Interpretation
Based on the outputs of our regression analysis, we see that the iPhone's market share is heavily dependent on carrier subsidies but, interestingly, does not depend on purchasing power in a given country. More than 70 percent of the variation in the iPhone's market share can be explained exclusively by carrier subsidies. This figure improves to more than 80 percent if we consider NPD's US market share figures, which not only proves the dependence of the iPhone's market share on carrier subsidies, but also that our model is fairly accurate. We have also been able to prove that carrier subsidies have no impact on the market share of Android smartphones.
Using the derived coefficients from the regression analysis, we can derive an estimation of the iPhone's market share in any country:
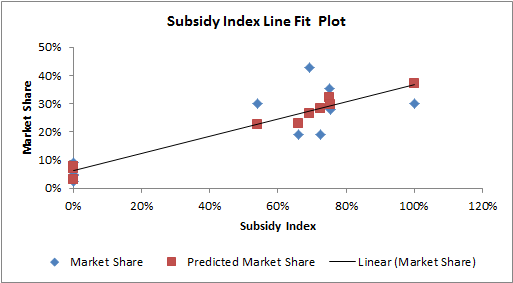
iPhone Market Share = 6.3% + 0.305 x Subsidy Index
The intercept of 6.3 percent gives us an indication of the impact of Apple's brand strength on its market share and a rough estimate of the expected market share in a world without carrier subsidies. Clearly, this is far lower than the impact carrier subsidies have on its market share.
The value of the intercept may not necessarily be accurate as it may depend on the brand loyalty for Apple in that particular country as compared to other manufacturers. But the model can accurately estimate the impact of changes in carrier subsidies on the iPhone's market share. For the US market, this translates into the iPhone losing roughly 4-5 percent in market share for every $100 reduction in carrier subsidies.
Based on the output of the regression model, it is clear that the iPhone derives most of its market share thanks to carrier subsidies and the impact of other factors like brand loyalty are comparatively low. Stay tuned for my next article on why the iPhone is so dependent on subsidies and why this will be a big problem for Apple.
Sameer Singh is an M&A professional and business strategy consultant focusing on the mobile technology sector. He is founder and editor of tech-thoughts.net.

