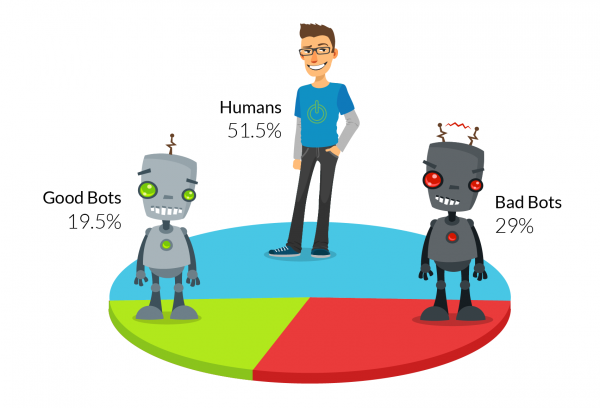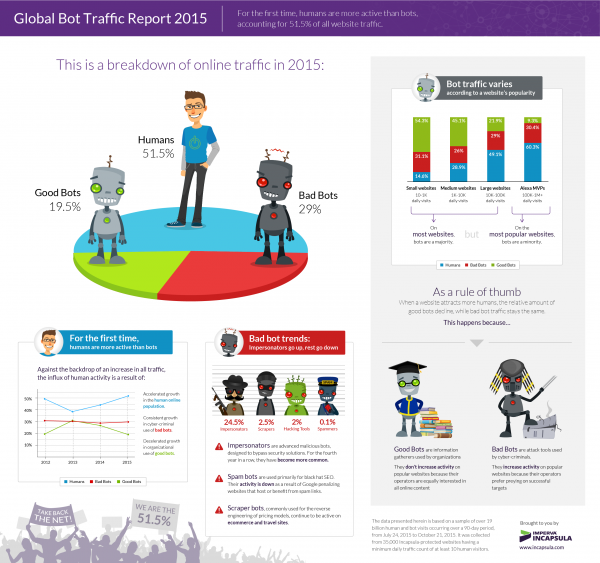
For the first time in five years, humans were the ones responsible for the majority (51.5 percent) of all online traffic, up from just 38.5 percent in 2013.
This is according to the latest Imperva Incapsula Bot Traffic Report which shows that good bot traffic decreased, from 31 percent in 2013 to 19.5 percent in 2015, while bad bot traffic remained static, at around 30 percent.
What's the difference between good and bad bots? Good bots assist the web's evolution and growth. Their owners are legitimate businesses who use bots to assist with automated tasks, including data collection and website scanning.
Bad bots are the malicious intruders that swarm the internet and leave a trail of hacked websites and downed services. Their masters are the bad actors of the cyber security world, from career hackers to script kiddies. In their hands, bots are used to automate spam campaigns, spy on competitors, launch DDoS attacks or execute vulnerability scans to compromise websites on a large scale.
The decline in good bot traffic isn't simply due to greatly reduced activity by a few groups of bots. The report shows that it's across the board, with 442 of 484 good bot clients displaying negative growth or an extremely low growth of less than 0.01 percent. Individually, none of them declined by more than two percent. Moreover, out of 42 good bots that displayed increased activity, only one displayed an increase of more than one percent.
Another interesting finding is that bot traffic to small and medium sized websites is increasing while that to larger and more popular sites is down. Human traffic on the other hand is up thanks to an increase in the number of people able to access the web and the fact that we're staying online for longer.
Analysis of bad bot traffic shows that while 'impersonators' -- bots designed to bypass security solutions -- are up, other types are down. This includes a decline in spam bots, put down to the fact that Google penalizes hosts and sites that benefit from spam links.
You can see more of the report's findings in infographic form below.


