


By Scott M. Fulton, III, Betanews
We did not have the Comprehensive Relative Performance Index (CRPI -- the "Creepy Index") out for very long before we found it needed to be changed again. The main reason came from one of the architects of the benchmark suites we use, Web developer Sean Patrick Kane. This week, Kane declared his own benchmark obsolete, and unveiled a completely new system to take its place.
When the author of a benchmark suite says his own methodology was outdated, we really have no choice but to agree and work around it. As you'll see, Kane replaced his original, simple suite that covers all the bases with a very comprehensive, in-depth battery of classic tests called JSBenchmark that covers just one of those bases. For our CRPI index to continue to be fair, we needed not only to compensate for those areas of the old CK index that were no longer covered, but also to balance those missing points with tests that just as comprehensively covered those missing bases.
The result is what we call CRPI 2.2 (you didn't see 2.1, although we tried it and we weren't altogether pleased with the results). The new index number covers a lot more data points than the old one, and the result...is a set of indices that are stretched back out over the 20.0 mark, like the original 1.0, but whose proportions with respect to one another remain true. In other words, the bars on the final chart look the same shape and length, but there are now more tick marks.
General explanation of the CRPI
Since we started this, we've maintained one very important methodology: We take a slow Web browser that you might not be using much anymore, and we pick on its sorry self as our test subject. We base our index on the assessed speed of Microsoft Internet Explorer 7 on Windows Vista SP2 -- the slowest browser still in common use. For every test in the suite, we give IE7 a 1.0 score. Then we combine the test scores to derive a CRPI index number that, in our estimate, best represents the relative performance of each browser compared to IE7. So for example, if a browser gets a score of 6.5, we believe that once you take every important factor into account, that browser provides 650% the performance of IE7.
We believe that "performance" means doing the complete job of providing rendering and functionality the way you expect, and the way Web developers expect. So we combine speed, computational efficiency, and standards compliance tests. This way, a browser with a 6.5 score can be thought of as doing the job more than five times faster and better.
Here now are the ten batteries we use for our CRPI 2.2 suite, and how we've modified them where necessary to suit our purposes:
- Nontroppo CSS rendering test. Up until recently, we were using a modified version of a rendering test used by HowToCreate.co.uk, whose two purposes have been to time how long it takes to re-render the contents of multiple arrays of <DIV> elements and to time the loading of the page that includes those elements. The reason we modified this page was because the JavaScript onLoad event fires at different times for different browsers -- despite its documented purpose, it doesn't necessarily mean the page is "loaded." There's a real-world reason for these variations: In Apple Safari, for instance, some page contents can be styled the moment they're available, but before the complete page is rendered, so firing the event early enables the browser to do its job faster -- in other words, Apple doesn't just do this to cheat. But the actual creators of the test themselves, at nontroppo.org, did a better job of compensating for the variations than we did: Specifically, the new version now tests to see when the browser is capable of accessing that first <DIV> element, even if (and especially when) the page is still loading.
Here's how we developed our new score for this test battery: There are three loading events: one for Document Object Model (DOM) availability, one for first element access, and the third being the conventional onLoad event. We counted DOM load as one sixth, first access as two sixths, and onLoad as three sixths of the rendering score. Then we adjusted the re-rendering part of the test so that it iterates 50 times instead of just five. This is because some browsers do not count milliseconds properly in some platforms -- this is the reason why Opera mysteriously mis-reported its own speed in Windows XP as slower than it was. (Opera users everywhere...you were right, and we thank you for your persistence.) By running the test for 10 iterations for five loops, we can get a more accurate estimate of the average time for each iteration because the millisecond timer will have updated correctly. The element loading and re-rendering scores are averaged together for a new and revised cumulative score -- one which readers will discover is much fairer to both Opera and Safari than our previous version.
- Celtic Kane JSBenchmark. The very first benchmark tests I ever ran for a published project were taken from Byte Magazine, and the year was 1978. They were classic mathematical and algorithmic challenges, like finding the first handful of prime numbers or finding a route through a random maze, and I was excited at how a TRS-80 trounced an Apple II in the math department. The new JSBenchmark from Sean P. Kane is a modern version of the classic math tests first made popular, if you can believe it, by folks like myself. For instance, the QuickSort algorithm segments an array of random numbers and sorts the results in a minimum number of steps; while a simplified form of genetic algorithms, called the "Genetic Salesman," finds the shortest route through a geometrically complex maze. It's good to see a modern take on my old favorites. Like the old CK benchmark, rather than run a fixed number of iterations and time the result, JSBenchmark runs an undetermined number of iterations within a fixed period of time, and produces indexes that represent the relative efficiency of each algorithm during that set period -- higher numbers are better.
- SunSpider JavaScript benchmark. Maybe the most respected general benchmark suite in the field focuses on computational JavaScript performance rather than rendering -- the raw ability of the browser's underlying JavaScript engine. Though it comes from the folks who produce the WebKit open source rendering engine that currently has closer ties with Safari, though is also used elsewhere, we've found SunSpider's results to appear fair and realistic, and not weighted toward WebKit-based browsers. There are nine categories of real-world computational tests (3D geometry, memory access, bitwise operations, complex program control flow, cryptography, date objects, math objects, regular expressions, and string manipulation). Each test in this battery is much more complex, and more in-tune with real functions that Web browsers would perform every day, than the more generalized, classic approach now adopted by JSBenchmark. All nine categories are scored and average relative to IE7 in Vista SP2.
- Mozilla 3D cube by Simon Speich, also known as Testcube 3D, is an unusual discovery from an unusual source: an independent Swiss developer who devised a simple and quick test of DHTML 3D rendering while researching the origins of a bug in Firefox. That bug has been addressed already, but the test fulfills a useful function for us: It tests only graphical dynamic HTML rendering -- which is finally becoming more important thanks to more capable JavaScript engines. And it's not weighted toward Mozilla -- it's a fair test of anyone's DHTML capabilities.
There are two simple heats whose purpose is to draw an ordinary wireframe cube and rotate it in space, accounting for forward-facing surfaces. Each heat produces a set of five results: total elapsed time, the amount of that time spent actually rendering the cube, the average time each loop takes during rendering, and the elapsed time in milliseconds of the fastest and slowest loop. We add those last two together to obtain a single average, which is compared with the other three times against scores in IE7 to yield a comparative index score.
- SlickSpeed CSS selectors test suite. As JavaScript developers know, there are a multitude of third-party libraries in addition to the browser's native JS library, that enable browsers to access elements of a very detailed and intricate page (among other things). For our purposes, we've chosen a modified version of SlickSpeed by Llama Lab, which covers many more third-party libraries including Llama's own. This version tests no fewer than 56 shorthand methods that are supposed to be commonly supported by all JavaScript libraries, for accessing certain page elements. These methods are called CSS selectors (one of the tested libraries, called Spry, is supported by Adobe and documented here).
So Llama's version of the SlickSpeed battery tests 56 selectors from 10 libraries, including each browser's native JavaScript (which should follow prescribed Web standards). Multiple iterations of each selector are tested, and the final elapsed times are rendered. Here's the controversial part: Some have said the final times are meaningless because not every selector is supported by each browser; although SlickSpeed marks each selector that generates an error in bold black, the elapsed time for an error is usually only 1 ms, while a non-error is as high as 1000. We compensate for this by creating a scoring system that penalizes each error for 1/56 of the total, so only the good selectors are scored and the rest "get zeroes."
Here's where things get hairy: As some developers already know, IE7 got all zeroes for native JavaScript selectors. It's impossible to compare a good score against no score, so to fill the hole, we use the geometric mean of IE7's positive scores with all the other libraries, as the base number against which to compare the native JavaScript scores of the other browsers, including IE8. The times for each library are compared against IE7, with penalties assessed for each error (Firefox, for example, can generate 42 errors out of 560, for a penalty of 7.5%.) Then we assess the geometric mean, not the average, of each battery -- the reason we do this is because we're comparing the same functions for each library, not different categories of functions as with the other suites. Geometric means will account better for fluctuations and anomalies.
Next: The other five elements of CRPI 2.2...
The other five elements of CRPI 2.2
- Nontroppo table rendering test. As has already been proven in the field, CSS is the better platform for rendering complex pages using magazine-style layout. Still, a great many of the world's Web pages continue to use HTML's old <TABLE> element (created to render data in formal tables) for dividing pages into grids. We heard from you that if IE7 is still important (it is our index browser after all), old-style table rendering should still be tested. And we concur.
The creator of our CSS rendering test has created a similar platform for testing not only how long it takes a browser to render a huge table, but how soon the individual cells (<TD> elements) of that table are available for manipulation. When the test starts, it times the duration until the browser starts rendering the table and then ends that rendering, from the same mark, for two index scores. It also times the loading of the page, for a third index score. Then we have it re-render the contents of the table five times, and average the time elapsed for each one, for a fourth score. The four items are then averaged together for a cumulative score.
- Nontroppo standard browser load test. (That Nontroppo gets around, eh?) This may very well be the most generally boring test of the suite: It's an extremely ordinary page with ordinary illustrations, followed by a block full of nested <DIV> elements. But it allows us to take away all the variable elements and concentrate on straight rendering and relative load times, especially when we launch the page locally. It produces document load time, document plus image load times, DOM load times, and first access times, all of which are compared to IE7 and averaged.
- Canvas rendering test. The
canvasobject in JavaScript is a local memory segment where client-side instructions can plot complex geometry or even render detailed, animated text, all without communicating with the server. The Web page contains all the instructions the object needs; the browser downloads them, and the contents are plotted locally. We discovered on the blog of Web developer Ernest Delgado a personal test originally meant to demonstrate how much faster the Canvas object was than using Vector Markup Language in Internet Explorer, or Scalable Vector Graphics in Firefox. We'd make use of the VML and SVG test ourselves if Apple's Safari -- in the interest of making things faster -- hadn't implemented a system that replaces them with Canvas by default.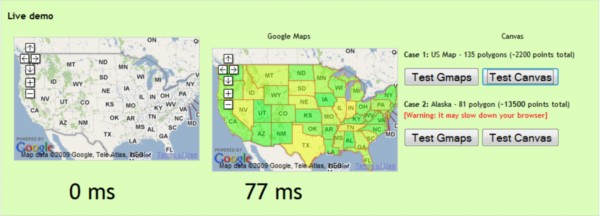
So we use Delgado's rendering test to grab two sets of plot points from Yahoo's database -- one outlining the 48 contiguous United States, and one set outlining Alaska complete with all its islands. Those plot points are rendered on top of Google Maps projections of the mainland US and Alaska at equal scale, and both renderings are timed separately. Those times are compared against IE7, and the two results are averaged with one another for a final score.
- Testnet.World JS performance test. A decade ago now, someone tried to make a respectable JavaScript benchmark suite out of estimating how long the engine took to execute common math instructions. To be able to count the estimate, each test would run a thousand or so iterations. For today's computers, they have to run 1,000,000. But at the time the test was released, it was criticized by many who thought timing just the single instructions over and over, didn't represent overall performance. It doesn't, but it does represent the efficiency of small parts of the engine, and it's precisely the part we needed to fill in after Sean P. Kane changed his benchmark suite. So this battery -- a rewritten version of the code at this address -- times how long it takes the engine to process 15 common keywords and regular functions, from
ifbranches toforloops to string concatenations, one million times each. Results are rendered in milliseconds, and scores in each heat are compared to those from IE7 in Vista SP2. The results are 15 per-heat relative index scores, which we then average out to gain a final score in the battery. - Acid3 standards compliance test. The function of the Acid3 test has changed dramatically, especially as most of our browsers become fully compliant. IE7 only scored a 12% on the Acid3, and IE8 scored 20%; but today, most of the alternative browsers are at 100% compliance, with Firefox at 93% and with 3.7 Alpha 1 scoring 96%. So it means less now than it did in earlier months to have Acid3 yield an index score of 8.33, which is the score for any browser that scores 100% thanks to IE7. Now that cumulative index scores are closer to 20, having an eight-and-a-third in the mix has become a deadweight rather than a reward.
So now we're making Acid3 count in a different way: For the other batteries that have to do with rendering (all three Nontroppos and TestCube 3D), plus the native JavaScript library portion of the SlickSpeed test, we're multiplying the index score by the Acid3 percentage. As a result, the amount of any non-compliance with the Web Standards Project's assessment is applied as a penalty against those rendering scores. Today, only Mozilla and Microsoft browsers are affected by this penalty, and Firefox only slightly -- all the others are unaffected.
Next: Our physical test platform, and why it doesn't matter...
Our physical test platform, and why it doesn't matter
The physical test platform we've chosen for CRPI browser testing is a triple-boot system, which enables us to boot different Windows platforms from the same large hard drive. Our platforms are Windows XP Professional SP3, Windows Vista Ultimate SP2, and Windows 7 RTM.
All platforms are always brought up to date using the latest Windows updates from Microsoft, prior to testing. We realize, as some have told us, that this could alter the speed of the results obtained. However, we expect real-world users to be making the same changes, rather than continuing to use unpatched and outdated software. Certainly the whole point of testing Web browsers on a continual basis is because folks want to know how Web browsers are evolving, and to what degree, on as close to real-time a scale as possible. When we update Vista, we re-test IE7 on that platform to ensure that all index scores are relative to the most recent available performance, even for that aging browser on that old platform.
Our physical test system is an Intel Core 2 Quad Q6600-based computer using a Gigabyte GA-965P-DS3 motherboard, an Nvidia 8600 GTS-series video card, 3 GB of DDR2 DRAM, and a 640 GB Seagate Barracuda 7200.11 hard drive (among others). Three Windows XP SP3, Vista SP2, and Windows 7 RC partitions are all on this drive. Since May 2009, we've been using a physical platform for browser testing, replacing the virtual test platforms we had been using up to that time. Although there are a few more steps required to manage testing on a physical platform, you've told us you believe the results of physical tests will be more reliable and accurate.
But the fact that we perform all of our tests on one machine, and render their results as relative speeds, means that the physical platform is actually immaterial here. We could have chosen a faster or slower computer (or, frankly, a virtual machine) and you could run this entire battery of tests on whatever computer you happen to own. You'd get the same numbers because our indexes are all about how much faster x is than y, not how much actual time elapsed.
The speed of our underlying network is also not a factor here, since all of our tests contain code that is executed locally, even if it's delivered by way of a server. The download process is not timed, only the execution. Why don't we care about download speeds, especially how long it takes to load certain pages? We do, but we're still in search of a scientifically reliable method to test download efficiency. Web pages change by the second, so any test that measures the time a handful of browsers consumes to download content from any given set of URLs, is almost pointless today. And the speed of the network can vary greatly, so a reliable final score would have to factor out the speed at the time of each iteration. That's a cumbersome approach, and that's why we haven't embarked on it yet.
There are three major benchmark suites that we have evaluated and re-evaluated, and with respect to their authors, we have chosen not to use. Dromaeo comes from a Firefox contributor whom we respect greatly, named John Resig. We appreciate Resig's hard work, but we don't yet feel his results numbers correspond to the differences in performance that we see with our own eyes, or that we can time with a stopwatch. The browsers just aren't that close together. Meanwhile, we've currently rejected Google's V8 suite -- built to test its V8 JavaScript engine -- for the opposite reason: Yes, we know Chrome is more capable than IE. But 230 times more capable? No. That's overkill. There's a huge exponential curve there that's not being accounted for, and once it is, we'll reconsider it.
We've also been asked to evaluate Futuremark's PeaceKeeper. I'm very familiar with Futuremark's tests from my days at Tom's Hardware. Though it's obvious to me that there's a lot going on in each of the batteries of the Peacekeeper suite, it doesn't help much that the final result is rendered only as a single tick-mark. And while that may sound hypocritical from a guy who's pushing a single performance index, the point is, for us to make sense of it, we need to be able to see into it -- how did that number get that high or that low? If Futuremark would just break down the results into components, we could compare each of those components against IE7 and the modern browsers, and we could determine where each browser's strengths and weaknesses lie. Then we could tally an index based on those strengths and weaknesses, rather than an artificial sum of all values that blurs all those distinctions.
Copyright Betanews, Inc. 2009


