
Internet access doesn’t make people happy, but it is a sign of the probability of happiness.
A 2013 poll by the Gallup-Healthways Well-Being Index measured people’s happiness state by state across America. We cross-referenced the Happiness Index from the Gallup Poll with US census numbers on the percentage of a states’ residents who access the Internet from their homes and found an interesting correlation. Nearly 40 percent of the happiness index score for any given state can be estimated by knowing the Internet access percentage of that state.
Related: Average US internet speeds -- how does your state compare?
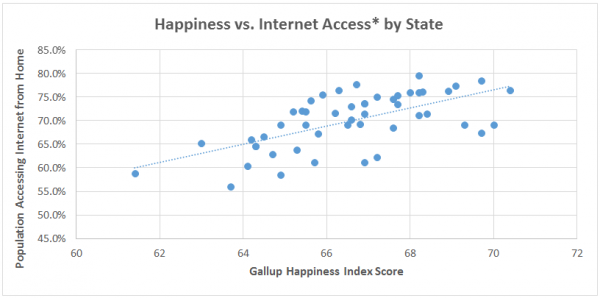
*Percentage of population accessing the Internet from their home
The R-square statistic for this linear regression is .38. This means, on average, 38 percent of the happiness score can be explained by the internet access percentage.
This is a correlation, not a causation. Of course there are other factors influencing this data. Many things effect a person’s happiness. Does this correlation occur because a high Internet access rate signifies a strong economic infrastructure, which could be conducive to happy people? Questions like that require more study and analysis. But, we can say that although Internet access doesn’t necessarily cause happiness, the two are related.
We explored the relationship further by using the Happiness Index Score and the Internet Access percentages to rank states from one to fifty, and then compared the two rankings. This helped us see the relationship more clearly on a state by state level.
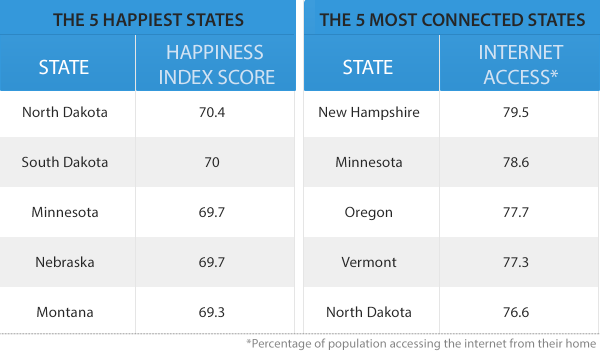
As you can see, North Dakota and Minnesota ranked highly on both lists. South Dakota, Minnesota, and Nebraska all ranked highly on the happiness list but not on the Internet access list, while Oregon did just the opposite. These four state were among only eight total states with a differential of 20 or more in their ranking between the two lists.
Having half of the observations that buck the trend show up in the top five suggests the correlation is weaker among states reporting the highest levels of happiness.
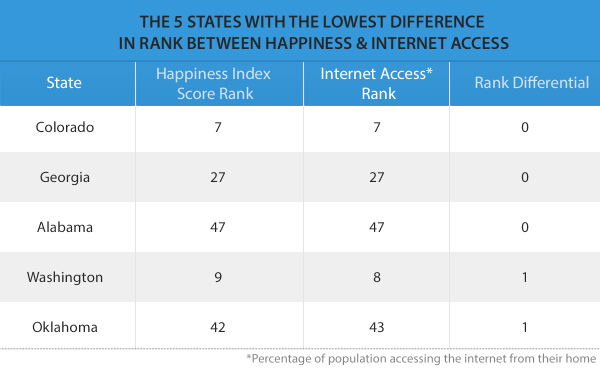
Despite the correlation weakening slightly at the top end, three states ranked exactly the same on both lists: Colorado (7), Georgia (27), and Alabama (47). Two more states were only one number off between the two rankings. Twenty-three states were within five spots on both lists and 33 states were within 10 spots. As mentioned earlier, only eight states were 20 or more positions away between the two lists.
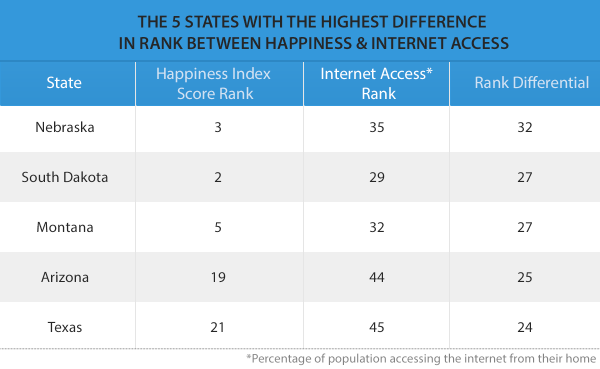
High levels of differentials suggest weaker correlation between happiness and Internet access among these states. This could be caused by any number of reasons. Perhaps people in these states define happiness differently than others, or they might access the Internet from places other than their homes.
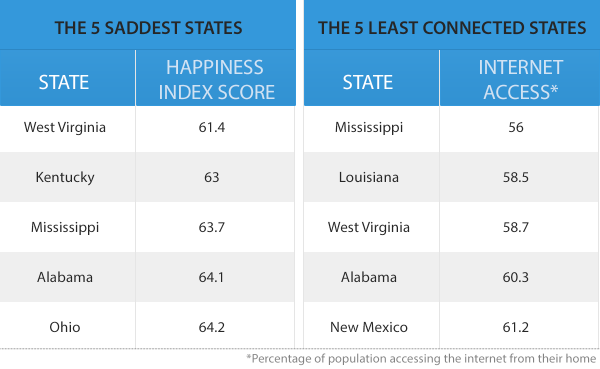
West Virginia, Mississippi, and Alabama all show up on the bottom of both lists. This shows a strong level of correlation in the lack of Internet access and the lack of happiness. Again, this is due to outside factors influencing both metrics.
What does it all mean?
This correlation is not one-to-one. Of the eight states that showed high (20 or more) differentials in their rankings comparison, five (South Dakota, Nebraska, Montana, Arizona, and Texas) showed a far greater degree of happiness than would be expected by their Internet Access Rank. With the other three states (Connecticut, Idaho, and Oregon) we would have expected to see a higher happiness ranking based on their Internet Access Rank.
Despite these outliers, statistically significant evidence exists to conclude, in general, people who live in a state with a higher percentage of its population accessing the Internet from home report being happier than those living in states with a lower percentage of the population accessing the Internet from home.
Does this mean that investing in Internet infrastructure can create happier people? Only time will tell.
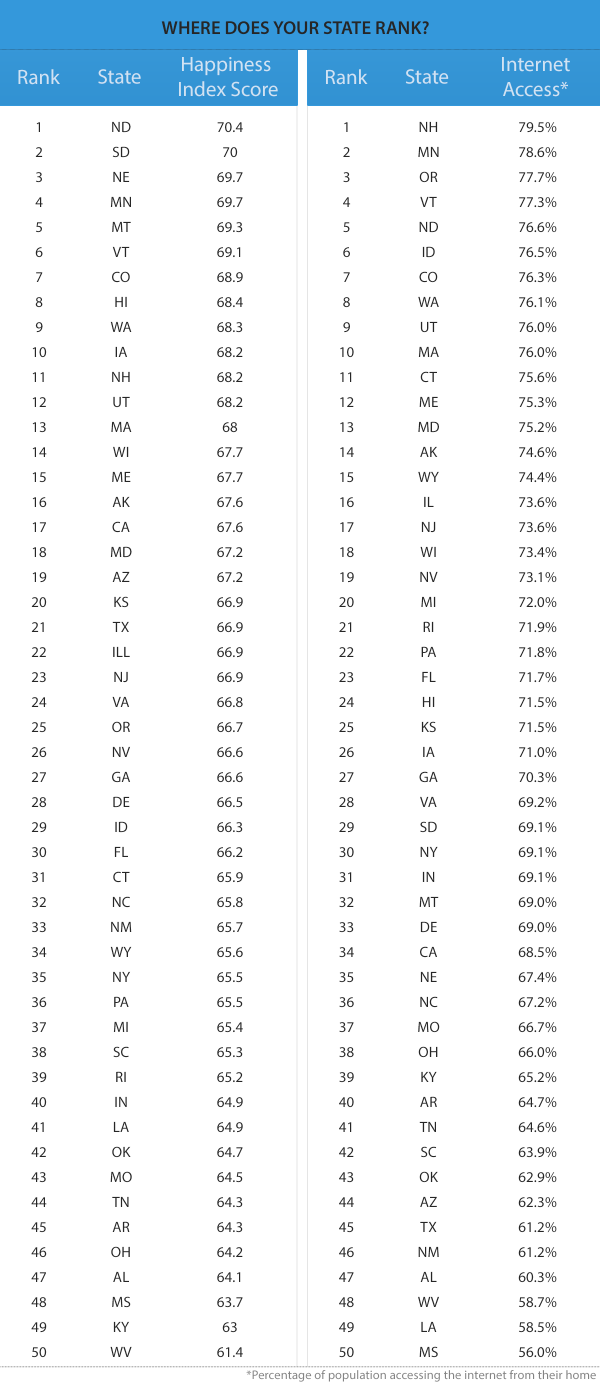
Photo credit: kurhan/Shutterstock
This post original appeared at highspeedinternet.com

