Software can fail for all kinds of reasons, but most programs will make at least some effort to explain the problem. Usually this is an error message, but it can also be worth checking the program logs, and maybe the Windows Event Viewer.
There is a more hidden option, though: some options generate debug output with low-level technical details on what they’re doing. This is intended to help developers troubleshoot any problems, but the messages are available to anyone -- and all they need is a copy of Trace Spy.
The program is free, portable, and under 300KB in size. It’s essentially a .NET version of Sysinternals DebugView, with filtering, trace colorization via regular expressions, and basic Event Tracing for Windows support.
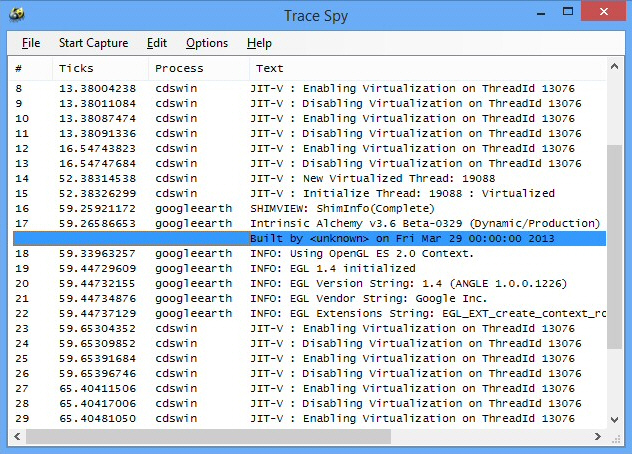
The good news: Trace Spy is extremely easy to use: just launch it and messages will be appear in real time.
The bad news: most programs don’t generate any debug output, and when something does crop up it’s typically very cryptic ("explorer 11872 0000000000000000 LEAVE: DllCanUnloadNow", "SearchProtocolHost JIT-V : New Virtualized Thread: 16672", and so on).
And yet, there are occasional exceptions.
When right-clicking a folder on our test system, Explorer generated a debug message complaining that it "failed to load resource DLL…", and pointed to an Apple file. We hadn’t noticed any symptoms, but if a folder hadn’t been displaying as we expected, this could have been a valuable clue.
Google Earth displayed some status information when it launched: Intrinsic Alchemy version, EGL version, vendor strings and more. Even if you’ve no idea what any of this meant, you could perhaps compare the debug output on this PC with a working system, and look for any differences.
Running VLC Media Player on our test system also produced some unusual debug output, including a warning of an "ES_OUT_RESET_PCR" error. We’ve no idea what that means, but if we were having a VLC problem then it could be a relevant, and a quick web search would tell us more.
Plainly, you shouldn’t expect too much from Trace Spy. Barely 5 percent of our test applications displayed any debug output, most of that is too cryptic to be useful, and what’s left requires some work to understand. But the program can provide occasional troubleshooting hints and clues, and on balance -- if you’re an experienced PC user -- Trace Spy deserves a place in your troubleshooting toolkit.

