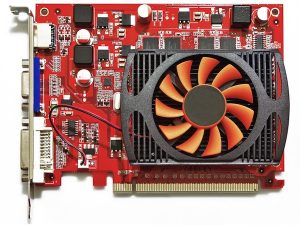
 The average graphics card is now a seriously complicated piece of kit, a host of complex subsystems and technologies working together to deliver the visuals you expect. When everything’s running smoothly then that’s just fine, as you don’t have to pay attention to any of this, but if your system’s misbehaving then GPU Caps Viewer may be able to help you find out why.
The program provides all the core details about your hardware, for instance: its GPU model, Shader cores, BIOS version, TDP, memory size and type. You’re able to monitor its current temperature, fan speed, clock rates, voltage and GPU load, too. Do you have the drivers you need? The program details your primary driver, OpenGL, OpenCL, CUDA and PhysX support on a single page.
GPU Caps Viewer also comes with several OpenCL and OpenGL demos, very handy if one of those technologies appears to be causing you a problem: if you run a demo and it also fails then you’ll know there’s a fundamental issue somewhere.
The program also includes plenty of developer-oriented details and tools. You can view all kinds of low-level OpenGL, OpenCL and CUDA information here, and there’s even a GLSL Shader Validation tool to check the compilation of a specified GLSL shader.
And usefully, GPU Caps Viewer comes in a portable form, so there’s no installation required, just unzip it to a USB key and the program’s ready to run anywhere: very convenient.

